Abstract: The need for reliable, fast and inexpensive soil investigation procedures has been felt in the local construction and consulting industry. The Electric Static Cone Penetrometer (CPT/CPTU) although widely used in more developed countries has seen very limited technical and commercial applications in our country due to its near total absence in commercial testing. This paper was originally prepared as a primer for our end-user units. However, it was expanded into this paper to present the State of Practice in the gathering of soil data using the Electric Cone Penetrometer (CPT/CPTU).
The various applications and limitations of the equipment and the procedures are discussed as well as findings on the results of local correlation tests conducted in the country. Directions on future applications and enhancements are also covered to fully exploit the potential of this testing method.
1.0 INTRODUCTION
1.1 General
The Cone Penetration Test (CPT) commonly known as the Static Cone Penetration Test (as opposed to the SPT, which is a Dynamic Penetration Test) or simply the Dutch Cone Penetration test, originated in the Netherlands.
It evolved out of the need to have a relatively simple and expedient test procedure that would be more economical and cost effective when compared to the SPT and yet yield meaningful data which could be useful in site characterization and the gathering of design parameters by correlation with extensive Insitu and Laboratory Testing results.
The CPT is most useful in stratigraphic interpretation where its value is unsurpassed. Because it is a continuous test of soil resistance, it can detect minute changes in stratigraphy and consistency/density and thus give a more reliable picture of the underlying soil conditions.
Due to the wealth of data accumulated in the past throughout its evolution, soil classification is relatively well defined through correlation charts using the three basic outputs of Cone Resistance qc, Friction Sleeve Resistance fs and their ratios fs/qc known as the Friction Ratio Fr. In the case of the CPTU or Piezocone, pore pressure u is also measured leading to improvements in correlations particularly for very soft clays and borderline characterizations. Invariably, correlation with local soils are necessary, particularly for borderline correlations, but for the major generic soil types, this is fairly well established.
The Chart (after Robertson, 1991) and included as Appendix “A” is recommended for initial classification by correlations. This would normally be augmented by a limited number of Boreholes to confirm or verify the local soil characteristics specifically in Borderline correlations to come out with Detailed Stratigraphic Information on the area investigated. Gathering of design parameters for Strength (Cu, ϕ ), compressibility (M & Dr) and other parameters have also been evolved by various researchers and for routine jobs, these correlations would suffice. For more important jobs, further tests using other established methods must be necessary such as laboratory tests and correlations with other test procedures such as the Vane Shear, Pressuremeter or Dilatometer.
1.2 History
The CPT originally started in 1932 in the Netherlands when P. Barentsen used a crude device which was made of a Gas pipe, inside of which a steel rod is inserted and to which a 60 deg. Cone was attached. This assembly was pushed down by hand, the cone resistance was read by a manometer.
Improvements to this crude device were made by Begemann resulting in a Mechanical Cone Penetrometer which added an “adhesion” jacket behind the cone tip. Using this new device, the Skin Friction could be measured by means of a manometer. Readings were made every 0.20m and the Rod string (Inner Rod and Outer Rod) is advanced alternately and incrementally while recording the manometers. A method for soil classification through the Cone Resistance and Friction Resistance became possible. In 1965 Begemann was also the first to propose that the Friction Ratio Fr could be used to classify soil layers in terms of soil type. 1]
The Electric Cone Penetrometer has eclipsed the use of the Mechanical Cone Penetrometers except for very limited applications where damage to the sensitive Electric Cone Tip is possible.
The Electric Cone Penetrometer was probably first developed in Germany during the war.
It was soon recognized that this was a very important development which eliminated the uncertainties and inaccuracies associated with the Mechanical Cone Penetrometer. Among its advantages relative to the Mechanical Cone Penetrometer are:
Elimination of erroneous interpretation of test results due to Friction between inner and outer rods.
A continuous testing with a continuous rate of penetration without the need for alternative movements of different parts of the penetrometer tip and no possibility for undesirable soil movements influencing cone resistance.
The simpler and more reliable electrical measurements of cone resistance with the possibility for continuous readings and easy recording of results.
Further improvements were made such as the incorporation of an inclinometer and introduction of a pore pressure (u) measuring system resulting in the CPTU or the Piezocone.
1.3 Details of the CPT
The Cone Penetration Test (CPT) is an In-situ procedure whereby a cone of Fixed Dimensions is pushed into the ground at a constant rate of 20mm/sec + 10%. The Penetrometer Tip as used in the Modern Day Electric Cone Penetrometer consist basically of four (4) major parts. The Cone, the Sleeve, the Inclinometer and the Body.
The cone has a 60 deg. Apex with a maximum diameter of 35.7mm with a height of 30.9mm and a shoulder height of 10mm. The maximum cross sectional area of the Tip Base is 1,000 mm2 corresponding to a diameter of 35.7mm and a height of the conical part of 30.9mm.
The Friction Sleeve has an outer cylindrical surface area of 15,000 mm2 + 2% which corresponds to a sleeve length of 133.7mm and is located above the tip.
The inclinometer detects and registers the inclination of the penetrometer from the vertical which is critical to prevent damage to the sensitive parts of the penetrometer or the drill string.
The body holds the three together and contains the Electrical Strain Gages to monitor the Tip and Friction Resistances and also the inclination reading in the form of electrical signals which are transmitted via connecting cable to an analog to digital converter which records the Friction and Tip Resistance and inclination versus depth and sends them to the computer. The computer then processes these data into usable output after interpretation of the signals using the prestored Penetrometer and Inclinometer Calibration Data.
The Cone is connected to a string of Push Rod which is inserted downward at a constant rate of Penetration of 20mm/sec by a thrust machine with a push capacity of at least 5 MT to 20 MT. Depth of Penetration is automatically recorded by a Linear Transducer synchronized with the other analog signals fed into the converter.
Normally, a Friction reducer is located above the penetrometer not less than 1,000mm from it. Schematically, the set up is shown below in Fig. 1.0:
1.4 Present State of Technology
Due to its reliability and popularity, the Electric Cone had undergone numerous improvements in accuracy and performance.
In addition, and due to advances in Electronics and Computer Technology, new capabilities are being added which would make possible the gathering of other parameters needed in Geotechnical Engineering and Geoenvironmental applications.
The development of more accurate and reliable strain gages has allowed the gathering of more reliable data. Multi channel capabilities, electronics miniaturization and improvements in signal processing and conversion have allowed gathering of various data concurrently or separately such as:
Cone Resistance (qc)
Friction Resistance (fs)
Inclination ()
Pore Pressure (u)
Seismic Wave Information
Shear Modulus G
Ground Water Chemical Properties
PH
Resistivity
Conductivity
Heat Flow (T)
Density (s), Moisture Content (MC) by Nuclear Probe
The Basic Electric Cone Penetrometer as we know it today, as a result of these advances, has come to be known as a rugged, reliable and relatively cost effective In-situ testing device for Geotechnical Engineering.
1.5 Test Standardization
During its early stages of Development, various sizes and configurations from various countries were in use. In order to provide reliable data through correlations, it was recognized that standardization was highly necessary as differing Penetrometer Geometry and the test procedures could produce highly differing test results. Since to some extent, soil strength is dependent on the rate of deformation (insertion of penetrometer) it was necessary to standardize this to 20mm/sec + 10%.
Several National Standards such as the Swedish Standard for Cone Testing and the US ASTM D-3441-86 have evolved.
In a bid to unify various national standards, the ISSMFE (International Society for Soil Mechanics and Foundation Engineering) came out with a reference Test Procedure which is expected to be adopted as The world standard for Cone Penetration testing. This is expected to be revised soon.
The present Swedish Standard for Cone Testing of 1993 exclusively refers only to the Electric Cone Penetrometer by specifying that measurements shall be done by Electrical means.
The mechanical cone is used less and less today because of related inacurracies and the cumbersome test procedure involved.
2.0 OFFICE & FIELD PROCEDURES
2.1 Equipment
Essentially, the Electric Cone Penetrometer set up would include the following:
Thrust Machine 20 MT Push Capacity (normally a special purpose Built Truck)
CPT Set
Cone
Friction Reducer
Push Rod String
Cable
Field Computer & Data Logger
Field Tools for Clearing and Maintenance of CPT
Office Computer
This is shown schematically in Fig. 1.0.
2.2 Office Procedure
2.2.1 Job Diskette Preparation
In order to avoid confusion in the Field, as invariably CPT Exploration would involve numerous exploration points per project and because the system is fully automated, it is necessary to prepare the exploration plan in the office.
Normally, Job Floppy diskettes would be prepared in the office which would contain the following information:
Job Number
Project Name
Location
Client Name
Cone & Inclinometer Calibration Data
2.2.2 Calibration
In addition, regular calibration at maximum 3 month intervals are carried out in the office as mandated by ISSMFE. The calibration is done to ensure that the cone & sleeve strain gages are within tolerance using a Force Transducer that is in turn calibrated to a higher standard.
2.2.3 De Airing of the CPTU
In addition to the foregoing and in the case of the CPTU (Piezocone), the Pore Pressure Filter System needs to be thoroughly deaired in order to ensure proper response of the Pore Pressure system to minute changes in Pore Pressure during the Pore pressure Dissipation test. This is done by subjecting the Filter to immersion in glycol inside a closed chamber. Vacuum is introduced to allow the air bubbles to boil out of the Filter and the Glycol solution. The Filter is shipped to the field completely immersed in Glycol using say a plastic or rubber sheath until it is inserted into the soil.
2.3 Field Procedure
2.3.1 Field Test Operations
In the field after equipment set up, the Job Diskette is loaded and the corresponding test point location is chosen.
The test is initialized by first ensuring zero (No Load) reading on the Penetrometer for qc and fs by hanging the CPT Cone in the Drill String on air. This is recorded antomatically by the software as a correction.
Normally a hole is predrilled by Auger on the Thin Dessicated Dry Crust to prevent damage to the CPT Tip before starting penetration
The verticality of the Push Rod and Thrust machine is checked in order to ensure that the thrust is vertically aligned. The deviation should not exceed 2% and the axis of the rods should coincide with the thrust direction. Normally levelling is done by Hydraulic Jacks.
The rate of penetration shall be 20mm/sec + 10% and stops are only made for Push Rod addition or when performing Pore pressure Dissipation Tests.
Readings are taken by the instrumentation and software for qc & fs at maximum 50mm (2 inches) increments averaged to within 50mm.
Depth of penetration is also recorded and measured with an accuracy of 100mm by an automatic linear transducer (Depth Gage) with a resolution of 10mm.
Most software have real Time Screen Displays of qc, fs, Fr, Inclination θ , Pore Pressure (u) and Rate of Penetration to enable the operator to control the operation and monitor critical parameters and ensure that tests are performed properly. The results are automatically stored in the hard disk of the Field Computer and the Job Floppy Diskette after the test.
2.3.2 Maintenance and Repair
In between tests, the penetrometer is visually inspected for any damage. All the seals are also inspected and any dirt inclusions are removed or cleaned to ensure proper performance during the test. If necessary, the penetrometer can be field disassembled to replace any broken seals or O-Rings and to lubricate the O-Rings.
2.4 Office Data Reduction
The data gathered in the field contained in the Job Floppy Diskette is sent to the office and is reduced and interpreted to yield the stratigraphy of the site investigated and other data which could be used for determination of Design Parameters.
Software is also available to automatically determine soil parameters but this has to be tempered with local experience.
3.0 TEST DATA GATHERING AND PRESENTATION OF RESULTS
3.1 General
The primary purpose of the CPT is to gather soil resistance data in order to effectively characterize the soil continuously with very little gaps in the stratigraphy. Through well established correlations and augmented by local experience, the site characterization is accomplished most efficiently. In stratigraphic characterization, the electric CPT is acknowledged to be the best insitu tool because it gives a continuous resistance profile of the subsurface. Because it is relatively inexpensive to perform, numerous points could be investigated to yield a more accurate horizontal characterization of the site.
Although various parameters obtained by correlation do not replace more accurate laboratory tests, the quality of data can be upgraded by local correlation. This is done by performing a limited number of boreholes and performing laboratory classification and strength tests (shear strength and compressibility) on the samples retrieved.
Essentially, stratigraphic characterization and parameters correlation (Strength, Compressibility, Dr, Gs, etc.) are obtained by the CPT through the continuous recording of the following data:
qc – Cone Resistance
fs – Sleeve Resistance Fr – Friction Ratio = fs/qc μ – Pore Pressure (for the Piezocone)
Because the CPT is standardized (As, Ap and rate of penetration) the correlation with numerous other tests performed in the past worldwide have given a wealth of data to make such correlations reliable.
These cone data are discussed individually: 2⎦
3.2 Cone Resistance (qc)
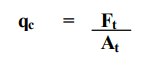
The cone resistance is the force per unit area which is obtained by the dividing the total axial force against the tip by the cross sectional area of the Tip Base (1,000 mm2).
Thus:
Alternatively:
In the special case where u = 0 or u is negligible, qc≈qt. The cone resistance is expressed in Mpa or Kpa.
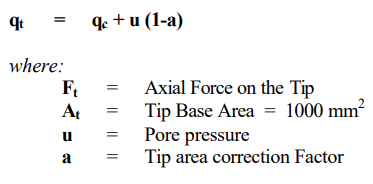
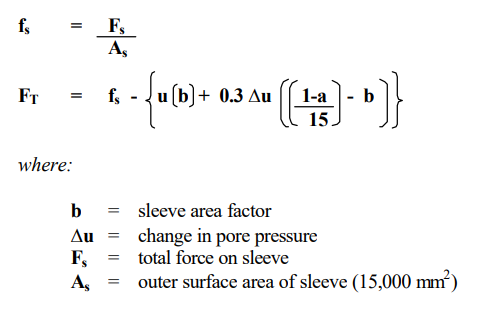
3.3 Local Side or Sleeve Friction (fs)
The local side Friction is obtained by dividing the total Friction force acting axially on the Friction Sleeve by the outer surface area of the sleeve.
In the special case where the pore pressure effects are zero or negligible, fs ≈ ft. The local sleeve friction is expressed in Mpa or Kpa.
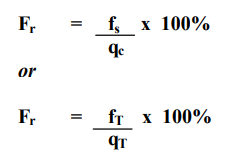
3.4 Friction Ration (Fr)
The Friction Ratio is the ratio between the local sleeve friction (fs) and the cone resistance (qc).
The ratio is expressed as a percentage. Normally, Fr for sands is seldom over 1% and for clays is normally > 4%.
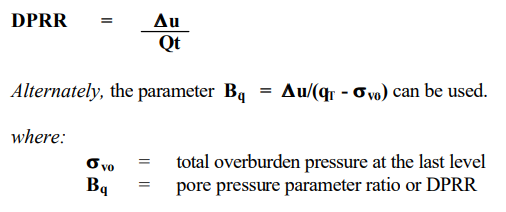
3.5 Pore Pressure u and Change in Pressure (Δ u)
With the advent of the CPTU or Piezocone, which measures pore pressure and enable the performance of Pore Pressure Dissipation Tests, more detailed tests can be performed and strength parameters for very soft soils can be obtained.
The Differential Pore Pressure ratio DPRR is the ratio between the generated pore pressure and the cone resistance at the actual level.
Recent studies have shown that even with careful procedures and corrections for pore pressure effects, the measurement of sleeve friction (fs) is often less accurate than the cone resistance.
To overcome problems associated with sleeve friction measurements, several classification charts have been proposed based on qT and pore pressures (Janbu and Senesset). The chart by Janbu & Senesset use the pore pressure parameter Bq.
Experience has shown that, although the sleeve friction measurements are not as accurate as qT and u, generally more reliable soil classifications can be made using all three pieces of data (qT , fs & u). Thus, the normal correlation charts for characterization is three dimensional. 1]
3.6 Pore Pressure Dissipation Tests 3⎦
The CPTU or Piezocone has the potential of providing estimates of the in-situ coefficient of consolidation from dissipation tests. A dissipation test can be performed at any depth by interrupting the penetration at that depth. This will be discussed in later sections.
4.0 INTERPRETATION OF CPT/CPTU DATA
4.1 General
Numerous studies and data correlation have been made in the past as the CPT/CPTU evolved from a simple penetration test to what it is today. With the advent of sophisticated electronics and test standardization, correlation with various soil parameters could be made with increasing confidence. However, as in all applications in soil mechanics, such correlations need to be tempered with local experience and local soil behavior and validated by actual Laboratory Tests until the local correlations are adequately established as to be reliable. Various soil information can be gleaned from the simple CPT Tests and when augmented with pore pressure data from the CPTU, increased accuracies and reliability can be obtained.
The following correlations and soil information may be obtained with the CPT/CPTU tests:
4.2 Stratigraphy
The CPT found its most useful and valuable application in stratigraphy and site characterization. And in this aspect, this insitu test is most superior to any existing method because it provides a continuous profile of the soil and is relatively inexpensive. Thus, more numerous test locations can be done providing a closer interval for visualization of soil conditions. For routine jobs the CPT test would suffice and for more critical jobs of large magnitude, the CPT can be augmented with a limited number of Boreholes and Laboratory Tests.
The stratigraphic characterization is obtained using the Basic CPT Data qc, fs, Fr and u.
The characterization is best done using the Three Dimensional correlation chart by Robertson (1990) and included in Appendix “A”.
Using raw CPT Data or normalized data, one can determine characteristic soil descriptions of soils using this chart. Only occassionally, when borderline cases are encountered in routine jobs, is there a need to do more detailed sampling by borings.
Robertson suggested that the charts are still global in nature and should be used as a guide to define soil behavior type based on CPT and CPTU data. Factors such as change in stress history, in situ stresses, densitivity, stiffness, macrofabric, mineralogy and void ratio will also influence classification.1]
Essentially for clays and silts, Cone Penetrometer is undrained thus measurement of Pore Pressure is important since the rate of PP Dissipation is a key to classification. Cone resistance should be corrected for pore pressure effects. In addition, measured pore pressures can also be used directly for interpretation in terms of soil design parameters.
4.3 Soil Unit Weight & Relative Density Dr
4.3.1 Soil Unit Weight (s)
Larsson and Mulabdic (1991) based on tests performed in Sweden and Norway, proposed the chart in Appendix “B” for obtaining a rough estimate of soil density for clays. This is an iterative procedure since an initial estimate of γ s is necessary to compute net cone resistance and Bq.
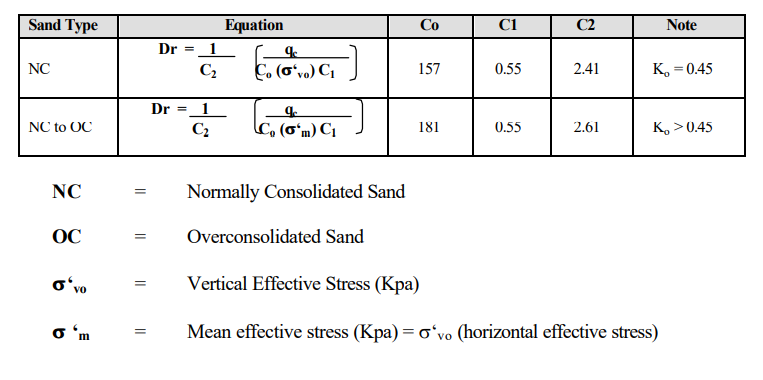
4.3.2 Relative Density Dr
Several relationships have been evolved for determining Relative Density (Dr) of Sands. However, ageing effects tend to increase cone resistance and no interpretation procedure could take account of ageing. Thus, to some extent, the obtained Dr should be referred to us “equivalent” Dr as recommended by Robertson. 1]
The value of Dr can be obtained from the chart in Appendix “D” or in equation form based on the values below:
4.4 Strength Characteristics
Various procedures have been evolved from which direct correlations can be obtained to yield soil strength parameters out of basic CPT data (qc, fs & u).
4.4.1 Clay & Fine Grained Soils
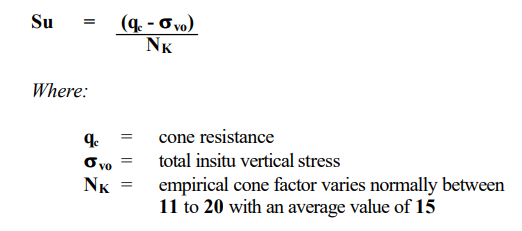
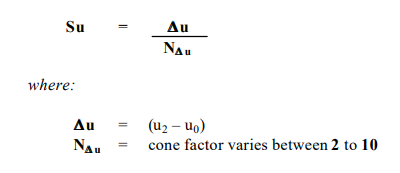
The undrained shear strength (Su) can be determined in several ways from empirical correlations.
The empirical correlation is of the general form
Robertson recommends the following procedures for Su determination: 1]
1) For deposits where little experience is available, estimate Su using the total cone resistance (qt) and preliminary cone factor values (Nkt) from 15 to 20. For a more conservative estimate select the upper limit.
For normally and lightly overconsolidated clays, Nkt can be as low as 10 and for stiff fissured clays as high as 30.
In very soft clays, where there may be uncertainties in the accuracy in qt estimate Su from the excess pore pressure (Δ u2) using NΔ u from 7 to 10 in the CPTU.
2) If previous experience is available in the same deposits, the value suggested above should be adjusted to reflect this experience.
3) For larger projects, where high quality field and laboratory data may be available, site specific correlations should be developed based on appropriate and reliable values of Su.
4.4.2 Coarse Grained Soils
Cone penetration in coarse grained soils is generally undrained, thus, no excess pore pressures are generated. Established correlations using large laboratory calibration chamber tests have been made with this assumption.
The procedure as recommended uses the charts in Appendix “E”.
The ϕ ′ from relatively uniform uncemented clean sand is empirically estimated from Fig. 5.56 in Appendix “E”. Figure 5.55 can be used to adjust the estimated ϕ ′ to account for variations in compressibility and Ko. A reasonably conservative value of ϕ ′ should be selected based on the range obtained.
4.4.3 Intermediate Soils (Clayey Sands to Silts)
The methods for interpretation applied for clays or sands may not be totally valid for silts as penetration in this material is partially drained. In this regard clay content of the silts is important.
It is important therefore to determine the type of drainage conditions encountered during the tests. If the design problem involves undrained loading and the CPT is undrained, then the CPT data can be interpreted in a manner similar to clay and similarly for drained loading and drained CPT in sands.
The CPTU Pore Pressure Dissipation tests could give the plot of pore pressure decay over the time the test was performed. From this data, τ 50 – the time for 50% dissipation can be obtained.
Robertson proposed a chart relating τ 50 (minutes) to Kh (cm/sec) since drainage in the CPTU is essentially horizontal.
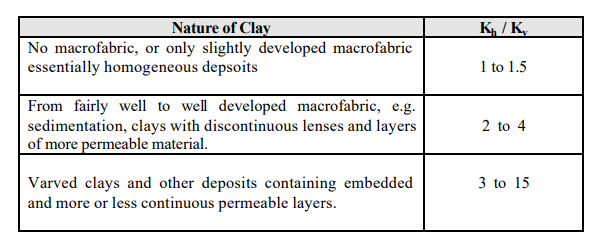
Vertical Permeability Kv can be obtained from well established field values relating Kv to Kh after Jamiolkowski 1985 and presented in chart form below:
4.5.2 Coefficient of Consolidation (Ch)
The coefficient of consolidation Ch in the horizontal direction can be approximated from the chart as proposed by Robertson (1992) from an extension of the work by Houlsby & Teh and shown in Appendix “F” relating τ 50 as defined above and Ch (cm/sec2). The relationship between Ch and Cv – the coefficient of consolidation in the vertical direction is obtained similarly from the above table relating Kh to Kv.
5.0 DIRECT APPLICATIONS OF CPT/CPTU DATA
In the foregoing section, interpretation of CPT/CPTU Data was directed towards correlation with soil strength parameters aside from other properties such as unit weight, relative density, stratigraphy, etc. These parameters in turn can be plugged into the various formulas (Theoretical or Empirical) to yield Bearing Capacity, Settlement, etc.
However, and particularly for Driven Piles, direct applications of CPT/CPTU Data could result in direct prediction of Pile capacity. The CPT procedure is a scale model of a Pile being inserted into the ground. Thus predictions of capaity are fairly more reliable. The reason being the ability to do continuous profiling of the subsurface soil response.
Superiority of the CPT method over non-CPT methods have been confirmed in other studies. 1]
Literature is replete procedures to use data gathered from the Electric CPT/CPTU Tests directly to provide solutions such as:
Pile Capacity and Settlement
Bearing Capacity of Shallow Foundations
Settlement of Shallow Foundations
Ground Improvement Quality Control
Liquefaction Assessment
In all the foregoing, reduction factors need to be applied to CPT Values. The need for such reduction factors is due to scale effects of the test, rate of loading or insertion technique. 1]
6.0 CONCLUSION AND SUMMARY
The foregoing presents the Electric CPT/CPTU its advantages and advantages in obtaining soil parameters needed in Geotechnical Engineering and Foundation Design.
Its ease of use resulting in reduction in cost of investigation without degradation of information obtained from such tests is certainly an important consideration.
It is hoped that this paper would pave the way for increased understanding and wide acceptance of the procedure as an invaluable tool in Soil Exploration.
ABOUT THE AUTHOR
Engr. Emil M. Morales Graduated from Mapua Institute of Technology where he earned his Bachelor of Science Degree in Civil Engineering. He Finished his Master of Science Degree in the same field at Carnegie Institute of Technology, Carnegie Mellon University, Pittsburgh, PA, USA.
He worked as a Project Engineer at D’Appolonia Consulting Engineers, Monroeville, PA. Where he was involved in the preparation of Software for Data Reduction for the Menard Pressuremeter.
He attended a short course in the Use of the CPT, Pressuremeter and the Dilatometer at Texas A&M University under Dr. Briaud.
He also recently trained in CPT Operations, calibration, maintenance and Software at the facilities of A. P. Van den Berg in Heerenveen, the Netherlands.
He is currently Chairman of the ASEP Geotechnical Committee and a Life Member of the same Association. He is also a member of the ASFE – Professional Firms Practicing in The Geosciences, ASCE, ACI, CRSI & ASTM.
1] Lynne and Robertson. “Cone Penetration Testing” 1st Ed., 1997. Blackie Academic Press, London, UK
2] Swedish Geotechnical Institute. “Recommended Standard for Cone Penetration Test”. Linkoping & Swedish 1992, Swedish Geotechnical Institute.
3] Briaud, J.L. “The Cone Penetrometer Test.” 1991 FHWA Office of Technology Administration, Virginia, USA
ABSTRACT: Quality in the Construction Industry and the workplace is a necessary ingredient for success. Too often, Quality is neglected sometimes with disastrous results.
As a Professional Design Engineering and Consulting Firm, we realized very early on that we needed to formalize our Quality Control procedures into a single coherent strategy in order to assure consistency and reliability of the Checking, Peer Review and Management Review processes. These activities were necessary not only to assure quality but also to safeguard our reputation and protect the general public by ensuring safe and cost effective designs.
The opportunity came when our biggest client, who was also getting into the ISO 9000 Quality System, required that downstream contractors and service providers also qualify for ISO 9000 Accreditation. We took the challenge and became the First Filipino Engineering Consulting Firm to be accredited under the ISO 9000 System.
This paper describes our quest for ISO 9000 accreditation which we would like to share with the Profession and the Construction Industry. Admittedly, as we shall soon find out, there is not “one single” Quality System for all and that Quality Systems and procedures should be attuned and tailor made to each individual organization’s needs. However, it is hoped that conscientious adherence to the ISO 9000 Quality System Guidelines and our experiences which we share in this paper will somehow help our Industry to become one of the most efficient, safest and cost effective sector in our country.
1.0 INTRODUCTION
We got introduced to the ISO System through the backdoor. Our sister Laboratory, Philippine Geoanalytics, Inc. just completed accreditation as the First Philippine Laboratory ever to be accredited under ISO Guide 25. The quality system was therefore in place in one of our sister organizations, although in this respect ISO Guide 25 is a more stringent system than ISO 9000 in that it required checking of the technical competency of the personnel to perform Laboratory Testing Procedures.
In addition, and more importantly, we were informed by our biggest client to prepare for ISO accreditation if we are to remain as a service provider for them. This client even sponsored our attendance in their in-house ISO 9000 Briefings and Seminars in order for us to fully understand the quality system and how best to synergize with them. Our client, who was actually on the verge of obtaining ISO 9000 accreditation for most of their plants was the catalyst in speeding up our process for accreditation.
This is not however to be taken as an indication of the lack of desire from within to seek ISO accreditation. For already, we were seeing the positive effects of what ISO Guide 25 was doing for our Laboratory—Morale was up, client satisfaction was at an all time high, income had increased by leaps and bounds, lost records and books have become a thing of the past and order has finally been restored in a very chaotic environment normally found in testing laboratories.
Thus, there was a very strong and compelling reason for us to qualify for ISO 9000 Accreditation.
This paper describes our preparations, documentation process and employee orientation. It is worthwhile mentioning that we undertook this assignment using exclusively our internal resources and manpower. We did not hire a pre audit service nor engaged consultants. This had the advantage that all our employees needed to participate to ensure our success. It was gratifying for us to observe teamwork in action, as our employees were highly motivated to accomplish this task.
How this happened is also discussed in this paper.
2.0 BENEFITS OF THE ISO QUALITY SYSTEM TO THE ENGINEERING ORGANIZATION
Although some of the benefits may not be readily apparent, a Quality System formalized and religiously implemented in an Engineering Organization can confer numerous advantages to it.
Oftentimes, compliance to ISO 9000 may be driven by the desire to comply based on client pressure or requirements. Sometimes it is done in the mistaken belief that ISO 9000 Quality System by itself can increase revenues or can assure quality of products or services.
But what are the true and real benefits of ISO 9000 to an Engineering Organization? In our case, the ISO 9000 Quality System had given us numerous benefits unimaginable before which are normally the least tangible benefits and these are:
Substantial improvement in internal operations.
Elimination of lost or misplaced documents and communications.
Simplified and formalized procedures for review and quality control of designs
Reduced time of document retrieval to within 5 minutes.
Increased employee awareness of the need to preserve quality and reduce errors to a minimum.
Traceability of design and drafting errors resulting in reduced error counts.
Increased employee morale because everyone knows their role in the organization and their importance in the maintenance of the Quality System and Procedures.
The foregoing may not be readily apparent to an organization seeking accreditation for the first time and it was to us a pleasant surprise that these came free with the package.
To us as Professional Designers, the foregoing are more important than the more often Touted Benefits because of the need to increase client satisfaction and also reduce our liability exposure.
There have been cases in our experience where our preservation of certain documents had saved us from costly litigation and claims. This would not have been possible without a fool proof document Archiving/Retrieval System that the ISO 9000 guidelines suggest.
The other more common benefits are of course the following:
Increased competitive advantage due to enhanced efficiency in procedures.
Customer preference for ISO 9000 companies with established Quality Systems.
Global acceptability of the ISO 9000 accredited company.
Orderly conduct of company business governed by procedures.
If we are to be asked what is the best benefit that has resulted from our seeking ISO 9000 accreditation, it is this:
We have reduced the chances for errors remaining undetected before implementation. Although errors cannot be entirely eliminated due to human factors or computer glitches, our formalized Quality Control system gave us the assurance and feeling of confidence that somehow we will find these errors before they can do some harm or cause loss of reputation.
As a matter of fact, it is not a sin in our organization to commit an error. However, it is a cardinal sin for everyone and anyone if we let an error go undetected through our various checks and counterchecks, as outlined in our Quality System. Somehow, this has given our employees High Morale.
3.0 BASIC UNDERSTANDING OF THE ISO 9000 SYSTEM
3.1 Background
The ISO 9000 standards originated from the IOS which is located in Switzerland . IOS is the acronym in French of the International Standards Organization. The ISO standards had its roots during the Second World War where methods of assessment of quality of wartime suppliers was very critical. This evolved into the MIL Standards and their Civilian Counterparts. Countries in the EU began to accept the values of a single standard for quality management systems resulting in the publication in 1987 of the ISO 9000 Series of Standards.1
3.2 What is ISO 9000?
ISO 9000 is a set of international standards for a Basic Management System of Quality Assurance. It is intended to equalize Quality Systems between companies and countries. 1
The following are the unique characteristics of the Quality System:
Flexibility – the requirements of the system are guides only and could be changed if the practices within an organization do not exactly match the requirements.
Wholistic – the standard looks at how the whole organization assures the quality of its products and services.
Focus on Quality Process – the standard do not focus on the final results but rather on the procedures for assuring quality.
Global – the standards have worldwide application and acceptability.
Broad Application – the standards can be applied to all aspects of business or operational procedures.
3.3 The ISO 9000 Family
The ISO 9000 Standards has five parts or is really a set of Five (5) Standards as defined1] below:
ISO 9000 – “Quality Management and Quality Assurance Standards – Guidelines for Selection and Use” is written to help companies determine which of the three standards to adopt or apply for registration.
ISO 9001 – “Quality Systems – Model for Quality Assurance in Design/Development Production, Installation and Servicing” is the standard for companies engaged in all aspects of manufacturing or of the development and delivery of a service.
e.g. A consulting Engineering Firm with a fully integrated Design Engineering function.
ISO 9002 – “Quality Systems – Model for Quality Assurance in Production and Installation” – is for companies that perform functions except the design and development of products and services.
e.g. A manufacturer that builds to prints and designs of a customer. A general contractor who builds based on plans supplied by the owner’s engineers.
ISO 9003 – “Quality System – Model for Quality Assurance in Final Inspection and Test” – is intended for non manufacturing companies such as distribution or warehousing entities. ISO 9003 is applied less and less and is expected to be dropped in the future.
ISO 9004 – “Quality Management and Quality System Elements –Guidelines” – is an overview of the themes and intent of the standards.
The key word in all of the foregoing titles is “Model” because the standards represent models of quality assurance rather than compulsory standards. Companies need only to match as closely and as economically, and as practically as possible the guidelines. This means that companies need not dramatically change their methods of quality assurance to meet the ISO 9000 Standards.
3.4 What It Is and What It Isn’t
The ISO 9000 Quality System is a set of Guidelines that is flexible.
It does not dictate the procedures to be practiced nor does it require a company to change its way of doing Quality Assurance if it is logical and effective. However, it provides a set of coherent guidelines to enable companies to meet minimum standards in the Global marketplace.
The ISO 9000 Standard is a requirement for a management system, not the structure of a quality department within an organization. There is not one correct Guideline and Procedure to follow. Each must be tailor made to suit the particular company’s operations and Quality Assurance procedures.
As a minimum, the standards provide a general pattern to follow. However, deviations or omission can and do occur depending on the company’s specific way of doing business which may be unique and requiring special procedures.
Common Misconception
It is sad to note that there are still lingering misconceptions about the ISO 9000 System and the quest to get there. These misconceptions should be clarified and erased before an organization can start its travel towards ISO 9000 accreditation. Some of these misconceptions are:
It is very difficult to comply with the standards.
The standards are rigid and inflexible.
It would take a long time to successfully comply.
It is very expensive to obtain and maintain.
It must be prepared by a consultant
It must be prepared and packaged by the management because employees would look at the standards with bias.
Employee compliance must be mandated from the top.
The quality system process must be management driven all the way.
It is not necessary provided you know what you are doing.
The documentation process is a waste of time and resources.
4.0 ESTABLISHING THE QUALITY COMMITTEE
Some of the major misconceptions in ISO 9000 accreditation are:
The process should be management driven.
You need a consultant to prepare the procedures and quality system.
Employees should be handed the complete procedure for their compliance.
The foregoing are quaranteed paths to failure because more than anything else, employee direct involvement is crucial to the success of any quality system. The effort should therefore be employee driven with the full logistical and moral support of top management.
We realized this very early on and we created a Total Quality Committee drawn from rank and file, tasked to prepare the company for accreditation. The Chairman of the Total Quality Committee in our case was a Lady Middle Level Engineer at that time and the following as representatives:
Management Representative – Technical Manager and Senior Partner
Engineering Representative – Junior Engineer representing Design Group And CAD Group
Admin Representative – Senior Clerk representing Admin and Non Technical Group
Q.C. Engineer – Full time Independent member of the Committee Designated as such.
The Total Quality Committee (TQC) spearheaded the company’s program for ISO 9000 Accreditation. It independently set the goals, milestones and work objectives of the company. Top management interference was unheard of and the main function of management was to keep the activities focused and monitor progress to attain a fixed deadline we have mutually agreed upon during the formation of the TQC.
The members were free to make the necessary suggestions and draft the procedures pertinent to their areas of operation. They were given blanket authority to draw upon any company resource or personnel in order to attain the objectives set by the TQC.
Directly under the TQC but not its members were two (2) Archive and Documentation Clerks. They received guidelines and instructions on the filing and records retrieval system being evolved and undergoing dynamic revision throughout the life of the TQC. These clerks were on full time assignment and were aided by our clerks and secretaries. They were not part of the mainstream operations as their job was to compile, catalog, file and debug the system. Little did we know that this decision saved us a lot of time and was partly instrumental in clinching the accreditation for the company.
As can be seen, the TQC was employee driven and this was very crucial not only to the preparation of the Quality System and Procedures but also in the subsequent implementation and maintenance of the Quality System. The procedures, having been originated by the employees themselves were widely accepted and embraced by all. In other words, the procedures were not rammed down the throat of rank and file but were prepared, polished and nurtured by them.
This to us is the single most crucial decision leading to the success of our Quest for ISO 9000 Accreditation.
5.0 PREPARING FOR ACCREDITATION
The Total Quality Committee established the necessary documentation requirements and the procedures needed to be documented. It also set out the guidelines for the archival and retrieval system.
The Quality Manual was reviewed and continually revised to contain new procedures or revised/eliminated/ outdated/superseded procedures.
Numerous working copies were reprinted for comments by employees as soon as these have undergone revisions- each revision being issued a Revision number. Thus, everyone got involved in the process of rewriting the procedures manual. The paper generated by the preparations was humongous but it was well worth the effort and time.
We also acquired several books on the ISO System which served as reference and guide for our efforts. Our books were the poor man’s substitute to a Consultant to assist in the accreditation process.
As part of our preparations and to serve as “Dry Run” to the Pre Audit and Audit activities ahead, we conducted internal audits using the checklist published in these references.
There was a compelling need to ensure that the system is thoroughly checked and debugged as external audits are expensive. In our case the Pre Auditor came from Austria and the Auditor from India. Both have to be billeted in Five (5) Star Hotels and their airfares paid for in addition to the Audit Fees charged by their company.
Thus, we can not afford failing in both audits and no room or allowance for non- compliance reaudits, and the rallying cry for the TQC is “Hit it one Time” this battle cry had a double meaning to us because HIT is our acronym for:
H – Personal Honesty
I – Integrity
T – Technical Excellence
We aimed for single pass Pre Audit and Audit and got it, saving us a lot of anxiety and plenty of hard earned money.
Dedicated as they were, the TQC members were driven by the Chairman who almost worked full time developing and coordinating the standards preparation. To add to the incentive, the Chairman was promised and got an all expenses paid trip to Hong Kong for getting accreditation in one pass. To get accredited in one audit was to us hard earned divine providence. The Internal Audits and Dry Runs were repeated until we were very satisfied that our system met ISO 9000 Standards. The personnel were in high state of morale and eager to get it over with.
We were ready!
6.0 THE DOCUMENTATION PROCESS
The main task in the ISO 9000 Accreditation Process is to ensure adequate Documentation of Procedures and Quality Systems. This also involved creating Document Filing, Archiving and Retrieval system to ensure the traceability and retrievability of all documents that need to be stored and that meant everything except junk mail.
No project document or communication was considered unimportant as not to be logged and stored in the archives.
The archived files consisted of Project Files which in our specific case involved:
⦁ Project Communications ⦁ Project Calculations ⦁ Project Plans & Drawings (Hard Copy, CD and Bernoulli Disk Files) ⦁ Project Specifications ⦁ Project Contract File ⦁ Estimates & Quantity Take Off
All these project files were interlinked and coded to assure fast retrieval and filing.
It is worthwhile to note that as a result of systematizing our document archiving and retrieval system, we can retrieve any project document within five minutes after the request for each documents is initiated. This includes travel time from the groundfloor to the third floor of our office.
In addition, lost document or lost files have become a thing of the past.
7.0 THE ISO 9000 QUALITY SYSTEM
7.1 ISO 9000 Elements
The ISO 9000 Quality System sets out Guidelines for companies to consider in the preparation of their Quality Systems and Procedures. It identifies vital elements that may comprise the system.
Note that in this definition, there are no mandatory statements such as “required” “shall” etc. Instead the words or phrases such as “consider” “may comprise” and that the provisions are “Guidelines”.
What this suggests is that the ISO 9000 is totally flexible and does not prescribe how the system should be done. It must completely suit each individual companies product or processes.
In our case, we evaluated the Guidelines element by element, and we adopted or incorporated those elements or sub elements related to our operations.
The following are the Elements for ISO 9001:
Management Responsibility
Quality System
Contract Review
Engineering Design Control
Document and Data Control
Purchasing
Control of Customer Supplied Product
Product Identification and Traceability
Process Control
Inspection and Testing
Inspection, Measurement & Test Equipment
Inspection and Test Status
Control of Non Conforming Product
Corrective and Preventive Action
Handling, Storage, Packaging, Preservation and Delivery
Control of Quality Records
Internal Quality Audits
Training
Servicing
Statistical Techniques
In our specific instance, we deemed all the twenty (20) Elements as necessary for our system but with a lot of modifications in order to suit our way of doing business and conducting our work.
It would be necessary to acquire references and guides such as the books mentioned in our references in order to have a clear and concise General Guide in preparing the Quality Manual and Procedures.
Emphasis is placed on the word “General” because the system and procedures are unique to the individual company’s operations.
The biggest temptation, is to copy some other company’s manual. This is a big mistake and a shortcut to failure due to lack of immersion and voluntary participation of rank and file.
7.2 ISO 9000 Levels of Documentation
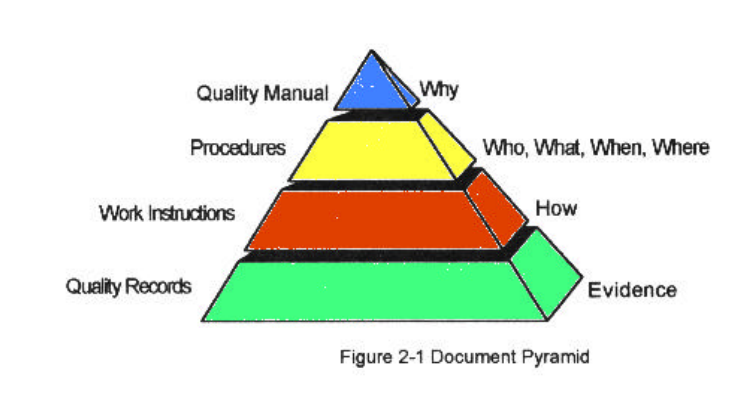
The ISO 9000 Guidelines is relatively flexible in terms of document structure. However, it is necessary to have several levels of documentation mutually supportive of each other in order to have a fully Integrated Quality System. In our case, we adopted the Document Structure Pyramid 2 commonly used by a lot of companies as shown below:
From the above, the documentation levels or hierarchy can be easily seen as follows:
LEVEL 1 Quality Manual – the Quality Manual answers the question: why? It is a company’s statement of philosophy and approach to quality. The Quality Manual discusses in general terms how the company complies with each element of the standard, it also includes the company’s quality objectives (such as “Zero Defects”), gives an overview of the company’s processes and contains the quality philosophy of the company.
The Quality Manual is the Bible for Quality for the company.
LEVEL 2 Procedures – The procedures document the company’s Quality Plan and defines the implementation strategy. It indicates compliance to the ISO 9000 Standards, demonstrate the processes and ensures that there are no loopholes in the system.
The procedures are process oriented and covers:
⦁ The Tasks: What? ⦁ The Responsibility: Who? ⦁ The Frequency: When? ⦁ The Department: Where?
Necessarily, the procedures should be written by the people who will use them. Not by a Consultant. Because the procedures are process oriented, we decided to Flow Chart our procedures. This had the advantage of:
⦁ Making it easily understandable by anyone reading it even without prior knowledge of flow charting. ⦁ Saving a lot of manhours and pages of paper during the preparation. ⦁ Enabling in thorough checking of the process as it was Graphical and easily checked. ⦁ Expediting the audit procedures enabling us to get accredited.
We saw the need to include 12 Flow Charts defining our operations. These are:
Proposal Preparation: New Clients Procedure Flow Chart
Awarding of Contract: New Clients Procedure Flow Chart
Awarding of Contract: Old Clients Procedure Flow Chart
Control of Client Provided Info/Data Procedure Flow Chart
Isuance of Documents and Books Procedure Flow Chart
Purchasing Procedure Flow Chart
Handling of Documents Procedure Flow Chart
Internal Audit & Reviews Procedure Flow Chart
Handling Client Request Procedure Flow Chart
LEVEL 3 Work Instructions – The work instructions answer the question How? They are the step by step instructions specific to the company’s procedures. Work instructions includes direction for doing specific tasks such as Checking and Peer Review, Document Storage and Retrieval, Handling of Complaints, etc. In our case, and for the same reasons above, we have integrated these into a procedures Flow Chart indicating the process, the documents needed or generated and the persons responsible.
The Quality Documents or Forms we generated are as follows:
Transmittal Letter
Project Summary Sheet
Request Form
Confirmation of Documents Received
Checkprint Report
Internal Project Bulletin
Internal Quality Audit
Complaints Form
Purchase Order
Quality Control Checklist
Weekly Project Monitoring
Zero-Defects Score Card Form
Statistical Record of Defects
Checklist of Client Inputs Form
LEVEL 4 Quality Records – The quality records provide evidence of the company’s compliance. They are the ongoing objective evidence of the system and evolve from the company’s procedures. The standards does not specify exactly which records to keep because the individual company has to define this depending on its process. However, most elements of ISO 9000 require Quality Records.
The records that we decided we needed to keep as a minimum are as follows:
Project Files
Hardcopy Plans
Electronic Plan Files (CD Format & 3.25 Floppy Diskettes)
In the generation of documents, it is necessary to focus on the company’s actual needs and the procedures that it implements. Some procedures may overlap and therefore can be joined into one detailed procedure. The
key thing to remember is to limit documentation to what is really essential to the Quality System defined procedures. More documents mean a larger number to manage (or neglect), fewer documents may mean larger and crammed individual documents which may decrease usefulness or reduce understanding. In addition, our Quality Manual included the following:
Quality Committee Table of Organization
Company Table of Organization
Amendments Record
Official Company Quality Policy Statement
8.0 PREPARING FOR THE PRE AUDIT AND FINAL AUDIT
In order to obtain proof of compliance that the ISO 9000 System is functional and being implemented within the company, a Third Party Independent Auditor (TPA) normally ISO certified as such would need to be engaged. The TPA would need to conduct a Pre Audit Review and as many audits as necessary until you run out of money or you obtain compliance. Because Third Party Audit is expensive, it would be necessary and imperative that the Quality system and procedures are fully debugged internally prior to Audit. Otherwise, non compliances could stretch the time and be very costly and demoralizing to both rank and file.
The Pre Audit
The pre audit is an audit conducted by the TPA in order to check: ⦁ Completeness of Quality Systems and Procedures (Elements involved) ⦁ Adequacy of Documentation to cover the company’ processes ⦁ Cursory evidence of implementation of the Quality System ⦁ Archived Documents and Document Retrieval system ⦁ Top Management commitment to the Quality System
We prepared for the pre audit as though it was our final audit. This involved at least 3 months of preparations and weekly staff orientation meetings. Each individual staff was given his own copy of the Draft Quality Manual which required voluminous printing of documents. Internal audits and peer audits were required at every step of the process. The pre audit required two (2) days to complete and to our relief, only minor non compliances were observed. Management and the TQC were briefed by the TPA on the deficiencies to prepare for the final audit. To our great relief we were told that we were ready for the final audit.
The Audit
More intense preparations were made to include training and retraining of staff in the implementation of the system. The audit, aside from being more rigid, would require individual interviews of staff chosen at random by the TPA. Everyone therefore must know the system by heart. Aside from the more detailed checks on the pre audit items, the following were done:
Interview of top management to determine level of participation or involvement in the quality process.
Meeting with the TQC to gage its inner workings and level of commitment
Individual staff interviews to determine level of understanding of the Quality System
Checking of Office Procedures
Checking that Software is validated
Test of the Document Archiving and Retrieval System
In this specific instance, several projects were randomly chosen by the TPA and related Files were requested to be presented. The retrieval time was monitored.
Also, as an example: a project was chosen and the work order and minutes of coordination meeting were requested to be exhibited.
Checkprints were asked to be displayed and compared with final plans to see whether all corrections were implemented.
The audit was conducted for three (3) straight gruelling days, and all office functions were directed towards the audit. Other activities not related to the Audit ground to a halt. That was how important the audit was to us. The TPA was crucial to us.
Besides, it would be very expensive for us not to pass the audit as the TPA had to be billeted again in a 5 Star Hotel and the Airfares (from Europe or elsewhere) had to be paid in addition to his man day rates.
9.0 COMPLIANCE AT LAST
It was a combination of very hard and dedicated work and the grace of God the Almighty that we successfully handled the audit and obtained acceptance of the company’s Quality System with a few minor comments in one pass. There was a feeling of general relief and satisfaction for a job well done.
We got our accreditation on June 14, 1996.
We had a reception to honor the members of the TQC and it also gave us the opportunity to thank our clients and announce to the world that our Quality System is at par with the World’s Best.
True to our promise, the Chairman of the TQC was given a 3 day Holiday in Hong Kong.
Morale was very high and everyone had a feeling of pride and accomplishment for a job well done!
10.0 MAINTAINING AND SUSTAINING THE SYSTEM
The effort does not stop at accreditation time. Yearly audits by the TPA are mandatory to retain Accreditation and Certification.
But to us, the incentive in maintaining the system is because we have seen that the system really works for us and has given us a very competitive advantage over peer companies.
To us, at least and to potential clients, “we are more equal among equals”. Whether this is true or not, is not the question. In our minds and our hearts we know that we are because we have a formalized system that works.
In closing, we wish to state that in this difficult times, an engineering company can survive or survive better with a formalized and working Quality System and as forces realign, the ISO 9000 accredited company is better positioned to meet a more discriminating and quality conscious client.
REFERENCES
Clement, R.B. “Quality Manager’s Complete Guide to ISO 9000”. 1993 Prentice Hall Inc., NJ.
Novack, J.L. “The ISO 9000 Documentation Toolkit”. 1987 Prentice Hall Inc. N.J. pp.20
Emilio M. Morales took up his Master’s Degree in Civil Engineering at the Carnegie Institute of Technology, Carnegie-Mellon University, Pittsburgh, PA. USA in 1981. He is formerly a Senior Lecturer of the Graduate Division, College of Engineering, University of the Philippines, Diliman, Quezon City. Presently, he is the Principal of EM2A Partners & Co., Technical Manager of Philippine Geoanalytics, Inc. and Technical Director of PGA Calibration & Metrology Laboratory. Committee Member, TC-11, Bureau of Product Standards Technical Committee on Steel Products. He is currently Chairman of ASEP Geotechnical Committee.
He can be contacted at: EM2A Partners & Co., 17-C Scout de Guia corner Scout Reyes Streets, Diliman, Quezon City. Telephone Nos. 371-18-06 / 410-29-23 to 24 Telefax No. 924-98-94; E-mail: em2apart@mozcom.com
With the advances in Ground Technology and Foundation Techniques, Difficult Foundation Problems involving Ground Distress, Settlements, Difficult Construction Conditions and Unstable Slopes are finding new solutions that were unheard of particularly in our country until very recently. One of these solutions now available in the country is Jet Grouting. Jet Grouting is a process of Ground Stabilization by high pressure injection of Cement Grount into the soil. Because of the controlled insertion, rotation and withdrawal of the high pressure Jetting Pipe, a columnar element of Grouted Soil known as “Soilcrete” is produced. The diameter and strength of this solidified mass of “Soilcrete” is controlled during the installation process. Although this description appears to be overly simple, the process is more complicated than the foregoing. In order to understand this fully, we need to go back to the historical development of Jet Grouting as the evolutionary processes have contributed to the present day technology and its successful application.
HISTORICAL BACKGROUND
The procedure and idea of using high velocity Jet Streams to cut, remove and cement soils were first originated in Japan starting around 1965 by the brothers Yamakodo. In early 1970, there were already two competing forms developed nearly simultaneously. The Jet Grouting technique developed by Nakanishi utilized chemical and cement grouts injected at ultra high pressure through very small nozzles (1.2 – 2.0mm Ø) which were located at the bottom of a single rod. Because the single rod is both lifted and rotated while jetting the grout, a pile like soil cement column is formed, from where arises the name of this type of Jet Grouting: chemical churning pile or CCP Jet Grouting. Water, Air and Cement Grout. Other variations in Jet Grouting quickly followed. The most important modification being the Jumbo Special Grout (JSG) which is essentially CCP Jet Grouting with air encapsulating the Cement Grout Jet. By merely using compressed air, the JSG columns are typically 1-1/2 to 2 times larger than ordinary CCP columns constructed using similar jetting parameters.1 Following this rapid development in Japan, the technology gained acceptance in Italy, Russia, Western Europe and very much later in the United States.
WHAT IS JET GROUTING?
Having seen the evolutionary process, we are now able to define Jet Grouting in its present form as used here in our country.
Jet Grouting is a ground stabilization procedure which uses the principle of Ultra High Pressure Injection of Cement Grout into the ground. The procedure employs a bottom-up installation sequence. The Double Tube or Triple Tube Pipe is rotated at a fixed RPM and automatically raised in fixed increments. The double tube system is used in the country. Cement Injection under Ultra High Pressure is done within a protective encapsulating conical shroud of compressed air. The compressed air allows increased ground penetration (larger diameters) by preventing significant pressure drops as the Grout leaves the nozzle.
Due to the Ultra High Pressures involved, the permeability of the soil is of no critical importance as the procedure relies more on the very high erosive power of the Jets to gain lateral Penetration. The solidified column of grouted soil is termed as “Soilcrete” and the compressive strengths would depend on the parent soil material and can be controlled to some extent by the Jetting Procedure. Soilcrete columns behave as a columnar pile with load carrying capacity coming from Skin Friction and Point Bearing. Typically, diameters would range from 0.8m to 1.4m. Jet Grouting is the only soil stabilization procedure that would work equally well in plastic clays and granular materials although compressive strengths and load capacity are typically higher in the latter material.
COMPONENTS OF THE JET GROUTING SYSTEM
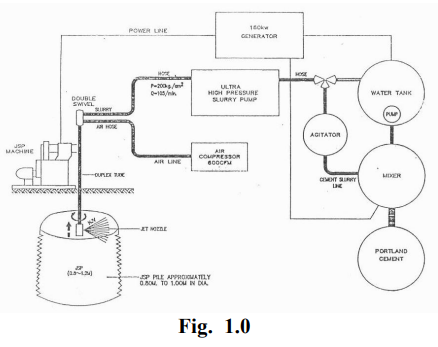
The schematic equipment layout shows the main components of the system.
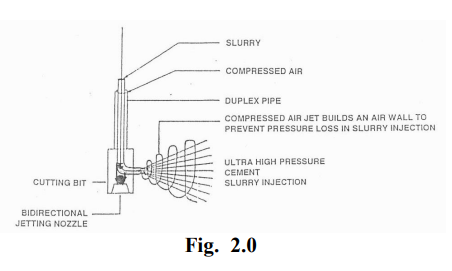
The heart of the system is the Ultra High Pressure Pump which generates pressure in the order of 200 kg/cm2. The Ultra High Pressure Slurry or Grout is fed to the inner tube of a double Tube Jetting Pipe. Compressed air to shroud the grout during injection is fed to the outer pipe. The discharge is sidewise through a small orifice nozzle approximately 1.2mm to 1.8mm in diameter. The pipe is inserted, rotated and raised in controlled increments by a Jetting Machine which is a modified drill rig with automatic hydraulic controls and timers. The Jetting pump possess very sensitive electronic monitors and controls which senses and adjusts the pumps strokes and speed to ensure constant pressure and controlled volume of grout injection. The rest of the system is composed of support elements such as:
Water Pump and Reservoir
High Speed Mixer
Paddle Agitator
Air Compressor 600 CFM
⦁ Generator
Of critical importance in the whole procedure and one which enables increased penetration of the Grout is the encapsulating conical air shroud which prevents sudden pressure drops during injection. The figure below illustrates the system:
INSTALLATION PROCEDURE
The accompanying figure illustrates the step by step installation of Jet Grouted Piles on any type of soil.
Appendix “A” illustrates the step by step procedure. First the double tube cutting bit is inserted and jetted into a soil through a downward Jetting Nozzle until the target depth is reached. This insertion and jetting disaggregates the soil and creates an annular cavity zone to allow for jetting to start. A ball bearing is dropped to close the downward pointing nozzle and divert the slurry injection through the side discharge nozzle (approximately 1.2mm Ø to 1.8mm Ø). At the same time, compressed air is injected through the outer orifice surrounding the side discharge center nozzle. This air shroud, conical in shape envelopes the slurry Jet to prevent its sudden decrement to athmospheric pressure. In addition, the hydrostatic head of the cuttings in suspension is prevented from contaminating the Jet and also from decreasing its pressure. As grout injection is progressing, the drill string is automatically rotated at the rate of approximately 7.0 RPM and raised in increments at the rate of 2.5 cm per second. Grout pressure is maintained at approximately 3,000 psi. In case of sudden pressure loss due to increased grout flow into voids or cavities, the automatic sensors in the pump system increases the pumping rate to ensure a nearly constant pressure and volume delivered. Once the procedure is completed, reinforcement can be installed by pushing down the rebar normally at the center. Installation of reinforcement along the side is possible provided the rebar insertion points are predrilled. However, ties can not be installed for obvious reasons.
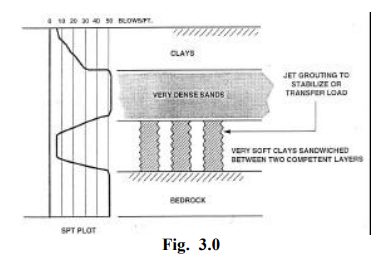
The Jet Grouted Pile normally should be terminated 1.0m to 2.0m below ground to allow for confinement of the Grout. The Grout within this space is normally weaker due to the same reasons. During the drilling, if obstructions are encountered, the jetting pipe can just core through the obstruction and later on incorporate the obstruction within the cemented mass. Grouting can also be at various levels not necessarily continuous as say to stabilize a weak layer sandwiched in between two dense layers.
UNIQUENESS OF JET GROUTING AS A SOIL STABILIZATION PROCEDURE
Jet Grouting as a soil stabilization procedure is quite unique as it overcomes some limitations inherent with other procedures such as:
⦁ Insensitivity to Low Soil Permeability
Due to the ultra high pressure injection of cement grout, highly erosive forces ensure grout penetration to the desired radius. The reduced permeability of clays does not adversely affect the grout penetration unlike unidirectional grouting procedures. Thus, the procedure is effective for both clays and granular materials.
⦁ Decreased Danger of Soil Fracturing or Heaving
Because the procedure is normally open to atmospheric pressures and because the nozzle is rotated at a constant rate, grout pressure build up which could lead to serious soil heaving or soil fracturing is eliminated. Even in cases where the hole is blocked, the increased pressure and reduced grout take is detected by the instrumentation to allow quick response of the crew and thus heaving is prevented.
⦁ Limited Headroom or Maneuver Space Requirements
The relatively small and lightweight equipment needed for installation allows Jet Grouting to be performed in very tight places for underpinning of existing Buildings or other works.
⦁ Automated Installation Process
The automated process of installation by control of rotation, raising of drill string and pressure/volume compensation by the ultra high pressure pump contribute to the highly predictable and consistent quality of the Jet Grouted Column. Thus, minimum compressive strength of the Soilcrete and the diameter of Grouted Column can be predicted with a reasonable degree of accuracy.
⦁ Ease of Installation
The procedure can be employed in difficult ground or working conditions and the Jet Grouted Pile can be installed in any angle with the vertical up to slightly less than 90 . Beyond 90 difficulty in retaining the Grout is encountered as grout flow out is possible.
⦁ Ability to Bypass Obstructions
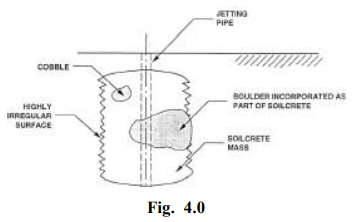
Jet Grouting has the unique ability to bypass obstructions such as boulders and buried structures and incorporate these into the cemented columnar mass. Thus, Boulders could be embedded and incorporated into the soilcrete mass and be part of the load support system. The sketch shows this graphically.
⦁ Increased Lateral Compaction of Soil
The ultra high pressure jet other than eroding the soil also increases the lateral compaction of the soil due to high pressure pulsating jet. Thus, some degree of densification is possible particularly for granular soils. The effectiveness of lateral compaction is at least a radius away from the perimeter.
⦁ Increased Frictional Resistance
The very uneven eroded surface produces a serrated configuration or a very highly irregular cylindrical surface. This increases the skin side frictional resistance of the Jet Grouted Column.
⦁ Reduced Permeability of Soilcrete
Cementation of the soil after washing and disaggregation helps eliminates voids and zones of high permeability because a uniform soilcrete body is formed. The permeability is in the order of 10-6 cm/sec very much like heavy impermeable clays.
⦁ Control of Depth of Installation
Since this is an insitu Bottom-up Installation Procedure, the depth of installation and the installation length can be controlled to the desired depth without wastage. In addition, the Grouting can be done at selective levels and need not be continuous.
APPLICATIONS IN DIFFICULT FOUNDATION PROBLEMS
Although Jet Grouting is not a cure all for all foundation problems that confront us day to day, there are difficult problems where it becomes the primary solution candidate or the only solution available. There are myriads of problems in foundation engineering where the effectiveness of Jet Grouting becomes a crucial factor in the selection process for a solution. We therefore group these into several classes of problems as follows:
⦁ Underpinning of Structures
Structural underpinning of existing structures becomes difficult particularly due to low headroom or space restrictions. In addition, disturbance of the already distressd structure or adjacent structures becomes a critical consideration. Jet Grouting eliminates most of these problems as the Jetting Machine can crawl into very tight spaces. Disturbance is minimal and avoided if installation is not concentrated in one area as to allow localized weakening of the soil support while the grout is curing. In addition, disturbance to adjacent structures is minimal as there is no vibration or shock. The Jet Grouting procedure could also be called upon to recover from settlements with the aid of chemical jacking. In addition, very expensive connection details can be avoided with Jet Grouting as the jet Grouted Section is very much bigger than the hole through the foundation being underpinned. Only a dowel might be required in such cases.
⦁ Landslides
The large cross sectional area of the Jet Grouted Pile and the ease of installation enable the use of Jet Grouting for the control of Landslides and creep. The shear resistance of the cross section can further be enhanced with the addition of soil reinforcement. The ability of the Jetting Machine to reach inaccessible areas makes it possible to strengthen unstable slopes on impending slide or areas subject to creep movements. In addition, areas where slides have occurred can be stabilized by the use of Jet Grouting essentially to reinforce the failed mass and strengthen it.
⦁ Seepage Cut Offs
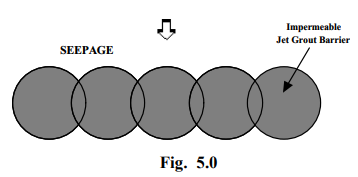
The very low permeability of the “Soilcrete” produced in the Jet Grouting Process allows it to be used as an Impermeable Barrier. Its ability to overlap in Secant Pile arrangement makes it water tight.
⦁ Foundation Piles
Particularly for very shallow applications in very tight or inaccessible areas, Jet Grouting is sometimes the only viable solution. Its large cross sectional area and highly irregular perimeter allows it to sustain large heavy loads controlled only by the strength of the Soilcrete material.
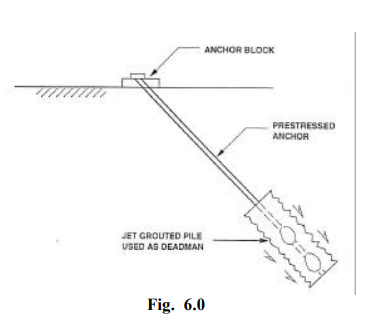
⦁ As Ground Anchors
Jet Grouted Anchors have been used in projects to provide a deadman or a large diameter anchor with appreciable pullout capacity. The use of High Tensile Strands drilled into and subsequently grouted inside the Jet Grouted Pile allows for large pullout loads and resistance against uplift. This is particularly useful for Temporary Ground Anchors on poor soils where the HTS length can be appreciably shortened or these could be used as Deadman for Anchored Sheetpiles or Bulkheads.
CONCLUSION
This paper has presented the State of Practice of Jet Grouting in the Philippines. Clearly, we have seen the versatility of Jet Grouting in the Solution of Difficult Problems in Foundation Engineering. However, it should be understood that Jet Grouting is not a cure all to foundation problems. There are some deterrents to its successful application, one of which is cost. Also, the procedure becomes non competitive to existing conventional foundation solutions where difficulty or restrictions on the use of such conventional solutions are non existent. In addition, the load carrying capacity of the Jet Grouted Pile is limited by the quality of the Soilcrete in a double tube system as the soil is not totally replaced by Cement Grout but is mixed with it. Several other examples of applications are included in the Appendix. It is hoped that a greater understanding of the system could lead to its full utilization in solving difficult ground conditions where conventional solutions are not feasible.
1 Kauschinger, et. al. “Jet Grouting: State of Practice” Vol. 1 Grouting, Soil Improvements and Geosynthetics – Geotechnical Special Publication, ASCE, NY 1992.
Of all activities in the realm of construction, nothing is as taken for granted as Earthworks. This is perhaps due to the misconception that “Soil is Soil” and that brute force alone will suffice in order to compact it. Nothing can be farther from the truth and numerous projects here and abroad have highlighted the important fact that soil can not be taken for granted as it can spell trouble in the construction site. The purpose of this paper is to focus on the special characteristics of various soils and how best to harness this knowledge for optimum construction expediency.
2. THE NATURE OF SOILS
Soil is an aggregation or assemblage of particles which are the products of weathering or decomposition or rocks. They could have been weathered in place or transported by wind or water. The manner of deposition as well as the parent material dictate how the soil behaves when subjected to loading or other environmental factors.
Soil particles are either visible to the naked eye or are submicroscopic. Being a particulate material, soil behaves differently than say a solid material. Particulate behavior can be fully understood and once this is so, the treatment of problems involving soils and soil particles becomes simpler. Soil is a structural material, but unlike other construction materials with known or predictable properties that could be specified at design stage, the engineer has to contend with what he will encounter in the field. Being a natural material, the soil will exhibit large variabilities even within the confines of a construction site. In most instances, soils must be used “as-is” and “where-is” because of its great bulk and difficulty of transporting such large volumes. Soil properties can also change with time and this must be anticipated. On the other hand, soil structure can also be altered by man in order to improve its characteristics significantly.
1) Soil Microstructure
Soil microstructure plays a very important part in the engineering behavior of soils. Soil structure can be altered or changed mechanically or chemically to produce desired characteristics for the project. Soil can either be Coarse Grained (sands and gravels) or Fine Grained (clays and silts). In addition, these soils can be adulterated say by organic materials as to effectively alter its characteristic behavior.
2) Coarse Grained Soils
Sands and gravels constitute the bulk of these soils , the individual sand grains are visible to the naked eye and are “gritty” to the trouch. Clean sands behave as particulate material. They derive their strength chiefly from contacts between the individual sand grains which results in “friction”. Although the individual grains may not be fully in contact with each other. The large concentration of stresses at the contact points produces increased resistance to sliding one past the other. Granular soil strength is essentially based on its Angle of Internal Friction “ϕ ” or its ϕ -Angle. The ϕ -Angle is not a unique value for a certain type of soil. Rather the ϕ angle is dependent on the degree of compactness of the soil and the confining pressure. The more compact and the more confined the granular soil is, the larger the ϕ -Angle. Coarse grained soils in their loose state are sensitive to vibration and are thus easily compacted by vibratory means whether very dry or in saturated state. When subjected to vibration, the loose coarse grained soils assume a denser packing and are thus compacted. A similar effect although to slightly lesser degree can be achieved by totally saturating the loose sands with water. The loose packing collapses with flooding by water and the soil assumes a denser packing.
3) Fine Grained Soils
Fine grained soils such as clays and silts are generally submicroscopic and the individual soil particles are not readily visible to the naked eye. Depending on the source or mineralogy, clays and silts may be plastic or non plastic.
Because of their very small size, the ratio of the surface area to the volume or mass is very very large and thus, surface activity due to electrochemical forces of attraction and repulsion come into play.
The shear strength or “cohesion” of these clays and silts are essentially derived from such forces and not through interparticle friction as one would suspect. The individual soil particles known as platelets are seldom in contact as they are surround by highly bounded adsorbed water due to electrical forces of attraction and further by absorbed water which is weakly bonded. Thus, the individual platelets slide one past the other because of these adsorb and absorbed layers of water. Compaction of this soil is dependent chiefly in expelling this absorbed water and any air with it to reduce the interparticle distance between clay platelets so that the forces of attraction is increased due to the reduction in distance. The resulting strength due to electrochemical attraction is known as “cohesion”.
4) Intermediate Soils
Intermediate soils are either predominantly granular or fine grained but have fractions of the other as to significantly alter its characteristic behavior in its unadulterated state. Data from tests made on sands used for molding indicate that its shear strength reaches a maximum and levels off with about 9 to 14% of clay depending on the clay mineral. If the clay content exceeds about 25% the strength degrades as the “Wedge Block” structure disappears and the individual sand or silt grain become separated and “floating” in a matrix of clay.2] When sufficient clay is present to form a matrix enclosing coarser grained soils (normally 25-30% clay), the structure of the clay dictates the structural behavior of the soil.
3. MOISTURE DENSITY RELATIONSHIP OF SOILS
1) Proctor Moisture Density Relationships
R.R. Proctor is generally regarded as the originator of principles dealing with a rational approach to soil compaction.3]
Proctor felt the need to have a laboratory compaction test to control field compaction operations. His first decision was the selection of a laboratory compaction energy that would simulate compaction energies imparted by construction equipment in the field.
He accomplished this by specifying a 5.5 lb hammer dropping at 12 inches height on soil samples confined in a 4″ diameter steel mold. This came to be known as “Proctor Density”.
Later on, as the need for bigger airplanes and wheel loads developed during the war years, it was found that the original compaction requirements for airfields and highways would need to be increased. Thus, higher compaction requirements resulted in the use of higher hammer energies in the laboratories. This came to be known as the “Modified Proctor” and the original Proctor Density became the “Standard Proctor Density”. The table below shows the comparison between the two methods:
It can be seen from the foregoing that Modified Proctor energy is 4.51 times that of Standard Proctor Energy. The two procedures came to be standardized as:
ASTM D-698 – “Laboratory Compaction Characteristic of soil using Standard Effort (12,400 ft-lb/ft3)”
ASTM D-1557 – “Laboratory Compaction Characteristic of soil using Standard Effort (56,000 ft-lb/ft3)”
There is a large difference in the compaction energy (and effort) needed in the laboratory and in the field to move from Standard to Modified Proctor Density.
Sometimes unknowingly or through ignorance, Engineers or the owner would specify the degree of relative compaction without specifying the reference as say: “to be compacted to 95% MDD” where: “to be compacted to 95% MDD based on ASTM D-698” would have been more appropriate.
4. IS THE PROCTOR MOISTURE DENSITY RELATIONSHIP APPRO-PRIATE FOR ALL SOILS?
This question does not often surface because there has been an implicit acceptance of this as the reference procedure for the compaction of all soils. In point of truth, this is not so as relatively clean coarse grained soils are insensitive to moisture content except in the extreme ranges of being very dry or highly saturated. The concept of “Optimum Moisture Content” (OMC) therefore is not applicable to clean coarse grained “Free Draining” soils such as sands and gravels.
The compaction of clean coarse grained soils are not referenced against Proctor Densities (Standard or Modified) but rather on the concept of Relative Density (DR) using ASTM D4253 “maximum Index Density and Unit Weight of Soils using a Vibratory Table” and ASTM D4254 “minimum Index Density and Unit Weight of Soils and Calculation of Relative Density” and plugging the minimum and maximum values obtained therefrom to arrive at the reference relative density DD for the material.
Thus, the Relative Density of the soil as calculated is different from the Proctor Density. Why then is Proctor Density still being specified for even clean sands? We can only guess that this is because of plain ignorance or probably the lack of test equipment for this test in the country. Although, relative compaction and Proctor maximum densities can be used, one is never sure whether the maximum density has been allowed or not. In most cases this is not attained.
1] Emilio M. Morales holds a Master’s Degree in Civil Engineering from Carnegie Mellon University, PA., USA and is currently the Chairman Geotechnical Specialty Committee. Currently, He is the Technical Director of Philippine GEOANALYTICS, Inc. Soils and Materials Testing Laboratory and can be reached through e-mail: pgamain@pgatech.com.ph www.pgatech.com.ph
2] Spangler, M. “Soil Engineering”. 4th Ed. Harper & Row Publishers. NY, NY 1982.
3] Monohan, E. “Construction of and on Compacted Fills”. Wiley & Sons, Inc. NY, NY 1986.
Abstract : The phenomenon of Swelling soils in the country is now only slowly being recognized, and Oftentimes only when this has manifested itself in the form of extensive damage to the structures or pavements. Most often, this phenomenon is wrongly attributed to settlement and the remedial or response measures are directed to correct the perceived “settlement” which based on the experiences of the Authors do not solve the problem and sometimes even aggravate or accentuate the problem by causing more damage.
Swelling soils are prevalent in the country due to the widespread deposition of Volcanic ash and materials. Because most of the published literature concerning swelling soils are from US sources or from South Africa particularly where these soils occur in dry desert climates, the occurrence of swelling soils in wet tropical climates have been wrongly discounted or ignored often with disastrous results.
This paper seeks to explore and explain the phenomena causing swelling and the attendant damage based on a “local setting” in order to highlight the importance. It has been said that 80% of the solution is in the identification of the problem and this is the focus of the Paper by the authors. The remaining part of the solution, the last 20% is directed towards Avoidance, Defensive measures before construction, as well as Remediation in case the problem has already manifested itself.
1 INTRODUCTION
Potentially expansive soils find wide distribution in the Philippines. The problems are most often unrecognized until it is too late and most often expansion or heaving is misinterpreted as “settlement”. Most of the time, damage to facilities and infrastructure is significant and very costly to repair and remediate.
The key to avoidance is early detection and this can be done initially by performing very simple and inexpensive soil index tests.
2 THE FORMATION OF SWELLING SOILS
Swelling soils find wide distribution in areas of volcanic deposition or origin with tropical climate and also in arid and/or semi desert climates. In tropical volcanic settings,
alumina rich volcanic ash gets deposited in general over a wide area. Some get concentrated in depressions or low areas which are almost always inundated or saturated with water. This regular inundation tends to leach the alumina and concentrate these at the bottom 1.0 meter to 2.0 meters generally but could be deeper depending on the leaching effects.
This explains the sporadic occurrence of expansive soils as generally, the expansive soils are not deposited area wide and thus portions of the project footprint may or may not be underlain by these soils.
3 ORIGIN OF SWELLING SOILS
In tropical volcanic environments, volcanic soils rich in alumina is deposited as Aeolian deposits. These Aeolian deposits settle in the land and are thicker in depressed areas. The alumina gets leached and concentrated due to ponding and saturation in the depressed areas. This alumina is the primary source of the expansive tendency and most often are shallow in occurrence due to the limited leveling effects.
4 DAMAGE TO STRUCTURES (Ref. 2.0)
Type of damages. Damages sustained by structures include: distortion and cracking of pavements and on-grade floor slabs; cracks in grade beams, walls, and drilled shafts; jammed or misaligned doors and windows; and failure of steel or concrete plinths (or blocks) supporting grade beams. Lateral forces may lead to buckling of basement and retaining walls, particularly in overconsolidated and non- fissured soils. The magnitude of damages to structures can be extensive, impair the usefulness of the structure, and detract aesthetically from the environment. Maintenance and repair requirements can be extensive, and the expenses can grossly exceed the original cost of the foundation.
Occurrence of damages. Damages can occur within a few months following construction, may develop slowly over a period of about 5 years, or may not appear for many years until some activity occurs to disturb the soil moisture. The probability of damages increases for structures on swelling foundation soils if the climate and other field environment, effects of construction, and effects of occupancy tend to promote moisture changes in the soil.
5 MECHANISM FOR MOISTURE INGRESS AND REMOVAL
Cyclical Water Ingress and Removal causes moisture imbalance that triggers the “Shrink-Swell Cycles”.
The cyclical nature of the “shrink-swell cycle” is caused by the periodic entry and evacuation of water in the soil. If only moisture equilibrium can be maintained within the structure then the damage due to cyclic movements of water into and out of the soil can be prevented or minimized. This points to one remediation measure that could be effective in remediating existing structures that have experienced damage due to swelling and shrinking of the soils.
The figure above taken from Ref. 4.0 shows how water can find its way into and under a structure. In addition several other soil mechanisms and behavior tend to cause this cyclic movement of soils into and out of the structure footprint causing shrink swell cycles.
The following properties help us to understand the swell and shrink tendency of highly plastic soils:
FINE GRAINED SOILS possess characteristic Crystal Lattices that are very small and could not normally be seen even under a Microscope.
These Crystals possess electrical charges. The finer the crystals the greater is the surface area and the attractive electrical charges.
The electrical attractive forces and the high affinity for water are very great as to cause separation of the clay platelets to adsorb the water and cations.
This continued adsorption and absorption causes the swelling of the soil which could be reversible during periods of evapotraspiration and Matric suction.
This phenomenon causes the shrink swell cycle.
Salt Cations in the soil water are attracted to the surface of the Lattice crystals to balance the Charges. These salt cations such as magnesium, alumina, sodium, potassium are dissolved in the soil water and adsorbed on the clay surfaces as exchangeable cations.
The hydration of these Cations can cause the attraction and accumulation of water between the clay particles.
Other Factors that Contribute to this are:
Soil Plasticity
Dry Density – the greater the density, the greater the expansive potential.
Initial Moisture Content
Moisture variation – if the moisture is balanced and there are no variations in moisture then the cycle is interrupted.
The figure above shows how Moisture variation is caused by natural processes. In addition to this, water tend to move from hotter areas to cooler areas (such as under structures) in a process known as “Thermal Migration”. Thus over a period of time water would be slowly injected underneath structures further aided by Matric Suction.
The moisture buildup does NOT necessarily coincide with periods of high rainfall or Moisture such as during flooding. This is because the fine grained nature of the expansive soils have very low permeability and thus we would sometimes find that swelling would occur after the rainy season or in a dry spell after considerable time from the exposure to inundation or saturation.
However, continued inundation or flooding of a surrounding area could cause heaving to occur after a period of time.
6 PATTERNS OF HEAVE
There are several patterns of heaving (Ref. 2.0) due to swelling soils that could occur or affect a structure depending on the Ground water regime or water infiltration and also the timing of construction:
6.1 Doming Heave Heave can occur as an upward long term dome shaped movement that develops over many years.
6.2 Cycle Heave A cyclic contraction – expansion related to drainage and the frequency and amount of rainfall and evaporation.
6.3 Edge Heave This kind of heave may be observable soon after construction in preconstruction vegetation and lack of topographic relief. Removal of vegetation leads to an increase in soil moisture while flat topography leads to ponding.
6.4 Lateral Heave Lateral thrust of expansive soil with a horizontal force approaching the passive earth pressure can cause bulging and fracture of basement walls and retaining walls.
The figure above show cracking on light residential structures and deformations in lightly loaded roadway pavements due to center lift and edge uplift (Ref. 2.0).
7 DETECTION AND IDENTIFICATION OF SHRINK SWELL TENDENCY
Detection of Swell tendency of soils is relatively simple and straightforward and normally relies on inexpensive laboratory tests that are part of the Soil Evaluation report. We refer specifically to the prevalence of SOIL INDEX TESTS such as the very well known “Atterberg Limits Tests” and grain size analyses to provide initial indication of expansive potential.
Oftentimes, more expensive tests may NOT even be needed during the early part such as the use of X-Ray Diffraction methods as well as Swell pressure tests. The Atterberg Limits are a telltale for expansive tendencies and numerous correlations with the Liquid Limit and the Plasticity Index as well as the Fine fractions (minus # 200 Sieve) have been published in literature to gage expansive potential of the soils.
But why are these tests NOT being used for this purpose? We believe that the reason is that Expansive potential is Not even recognized as a reality in a Tropical setting because most published literature about the subject always speak about occurrence of Expansive soils only in Arid Desert settings.
The figure below shows the various laboratory tests that could be undertaken to confirm the swell tendency of the soil by measurement of Volume change or Swell Pressure under confined conditions after the tendency has been initially identified.
The Figure “A” shows the free swell test where the soil specimen is allowed to swell in all directions under unconfined conditions in order to measure the magnitude of swelling that could occur under unrestrained conditions.
The test (Second Figure “B”) is to determine the swell pressure of a compacted specimen of soil under ZERO Volume Change or the constant Volume test. The Soil is saturated under the prescribed overburden and allowed to swell under lateral confinement. The heave is registered and the load is increased to return the soil to Zero Heave. The cycle is repeated until no further heaving is observed. The resulting load to return it to zero swell is the swell pressure.
In the Oedometer (Third Figure “C”) Swell Test, the Undisturbed or Compacted Specimen is Saturated and allowed to swell under increasing Load as in the regular consolidation Test. The amount of Swell is recorded as a % of the Specimen Height.
8 OUTLINE OF RESPONSE STRATEGIES BEFORE CONSTRUCTION
It would be far easier to avoid the problem brought about by swelling soils if this is recognized before construction is started rather than to undertake remediation when the problem has manifested itself. Thus a careful study of the area would be required in order to determine whether swelling would be a problem. This could be done by conducting simple reconnaissance of the surrounding areas to see whether cracking is manifested in the roadway pavements, fences and even the houses and by interviewing owners of adjacent properties. In addition, inexpensive soil index tests can be performed on suspect soils to determine whether the soil indices (LL & PI) as well as the Fine fractions (minus #200 Sieve) indicate swell potential or not.
The following are some of the response strategies that could be resorted to before construction, once the target site exhibits soils with swell tendency:
Removal of problem soils before construction
Typically, expansive soils have relatively shallow occurrences (to within 2.0 to 4.0 meters from the natural ground line (NGL) as the expansive alumina is concentrated by shallow leaching of the soils. However, there are also extensive deposits that are significantly thick and this would have to be ascertained. If the expansive soils are relatively thin, then removal would be the best solution to totally eliminate the problem. In case this is not possible, other solutions can be resorted to.
Elimination of source of water
Water triggers the expansion of swelling soils. The volume change is due to progressive adsorption and absorption of water. If water can be eliminated Totally (which would be at best difficult) then the problem is arrested. There is no clear cut and foolproof way of totally eliminating water under structures because of the infiltration of water from seasonal rainfall, from leakages in the domestic water system as well as the sewer system and due to Thermal Migration. Thus, this solution is NOT totally effective.
Maintainance of moisture equilibrium
The Shrink Swell cycle occurs due to seasonal or cyclic changes in water content. If the Moisture equilibrium can be maintained, then the initial swell that has occurred will no longer progress and shrinkage is prevented by preventing exit of the water underneath the structure. The key is to preserve the moisture balance as a way to avoiding progressive and periodic volume changes. This is done by providing impermeable vertical barriers (HDPE or GCL) sufficiently deep to prevent moisture migration both ways.
The vertical Moisture barrier in the figure below can be any durable impermeable liner such as HDPE or Geosynthetic Clay Liner or plastic walls (Cement Bentonite liner).
HDPE Barrier Walls has be n used successfully by the authors in several projects.
Reduction of soil compaction and compacting wet of OMC (Prewetting).
Surprisingly, reduction of compaction density could reduce the total swell magnitude. This is done by compacting the soil wet of optimum and by prewetting. The resulting lowered soil density will reduce the rebound swell magnitude in much the same way that a coiled spring will rebound less if the precompression is reduced.
However, controlling the migration of moisture complicates this solution and therefore the latter has to also be addressed in conjunction with this solution.
Chemical treatment with quicklime, Portland Cement or other stabilizing agents.
The liquid Limit and the Plasticity Index of expansive soils stabilized with quicklime abruptly decreases which also indicates that the swell potential is significantly reduced. The quicklime chemically reacts with the soils and reduces the activity of the soil as well as providing bonding of the soil particles as to reduce the swell potential. Stabilization by quicklime also increased the overall strength of the stabilized soil.
Other chemical stabilizing agents are also available that could act on the expansive soils but these should be tested in the laboratory before being used in the problem.
Structural Responses
Structural responses are resorted to if the other procedures are impractical or not feasible. These are discussed in more detail in subsequent sections and should be used as a last resort to gage effectiveness.
Countering the Swell Pressure Magnitude by Increasing the Intensity of Dead Load Contact Pressure
The contact pressure from the dead load is increased by reducing the footing contact area as shown diagrammatically below. The swell pressure has to be measured in the laboratory using the confined swell test or constant volume test to determine the maximum potential swell pressure that could be generated, simulating the actual density of the soil in-situ.
Thus, if the structural clement is heavier or larger than the swell pressure, no heaving would result.
The figure above (Ref. 2.0) illustrates the common procedure in increasing the deadweight contact pressure of the structure while at the same time making the slab stiffer. The Stiffened slab and Beam construction is designed to resist the swell pressure and the weigh of the structure is supported only as Line loads. Thus the deadweight effectively counteracts the Swell pressure.
A variation of this construction is by use of Post tensioned slab to further increase the stiffness.
Another defensive construction uses walls without footings or footings with large gaps or voids to increase the contact pressure.
The Wall becomes the Bearing element without any footing to increase the counterweight or with a reduced footing Contact area with Void Spaces to relieve the swell Pressure and Funnel it into the Voids.
⦁ Use of Piling
The use of piling to bypass the swelling soils and resist the swell uplift by anchoring the piles sufficiently or even with the use of belled bottoms is resorted to in extreme cases. The Floors are all structurally suspended on the piles so as not to be affected by the swell pressure.
The figure below illustrates the procedure: (Ref. 2.0)
The piles are often belled to increase the resistance against uplift.
⦁ Release of Floor slab
The floor slab is freed from any restraint and is removed from any contact with the swelling soil or the slab is totally free to move or “Float” with the swelling soil when heaving occurs.
9 RESPONSE AND REMEDIATION STRATEGIES FOR RESIDENTIAL BUILDING CONSTRUCTION
⦁ Swelling soils cause damage to thousands of homes every year.
The extent of the damage varies from cracked driveways and sidewalks to severe structural deformation.
Even well designed and constructed homes can be damaged if proper landscape installation and maintenance practices are not followed some precautions are necessary:
⦁ Don’t allow sprinkler systems to spray any closer than five feet from the foundation. And plant trees no closer than fifteen feet from the foundation.
⦁ It’s also important to carefully regulate water applied near the foundation. And avoid the temptation to remove downspout extensions to harvest water for flower beds near the house.
Also, avoid unlined plantboxes.
10 SUMMARY AND CONCLUSIONS
⦁ Potentially Swelling soils are Prevalent in our Country and must be recognized as a real problem.
⦁ The Reduction or Prevention of Damage is Relatively Easy and inexpensive if detected early before Construction through the conduct of simple Soil Laboratory Index Tests.
⦁ Once detected, the problem can be eliminated early on by removal as the swelling soils are relatively shallow in occurrence.
⦁ Remediation and repair of damage caused by swelling soils on the other hand is relatively very costly, difficult and disruptive and can be prevented if careful steps as above are taken before construction.
REFERENCES
1] Day, Robert W. Expansive Soil Foundation Movement. Foundation Engineering Handbook: Design and Construction with the 2006 International Building Code. 2] Department of the Army USA, Technical Manual TM 5-818-7. Foundations in Expansive Soils, 1 September 1983.
3] John D. Nelson and Debora J. Miller. Expansive Soils – Problems and Practice in Foundations and Pavement Engineering. Department of Civil Engineering, Colorado State University. 4] J.J. Hamilton. Canadian Building Digest, CBD-184. Foundations on Swelling or Shrinking Subsoils.
5] Jones, D.E. Jr. and W.G. Holtz. Expansive Soils – the Hidden Disaster, ASCE, Civil Engineering, August 1973, p. 49-51. 6] Williams, A.A.B. Discussion of the Prediction of Total Heave from Double Oedometer Test by J.E.B. Jennings and K. Knight. Transactions, South African Institution of Civil Engineers, Vol. 5, No. 6, 1958. 7] Bozozuk, M. and K.N. Burn. Vertical Ground Movements Near Elm Trees. Geotechnique, Vol. X, No. 1, March 1960, p.19-32. 8] Burn, K.N. House Settlements and Trees. Proceedings, National Conference on Urban Engineering Terrain Problems, May 1973. Associate Committee on Geotechnical Research, National Research Council of Canada, Division of Building Research, NRCC 13979 9] Bozozuk, M. Soil Shrinkage Damages Shallow Foundation at Ottawa. Engineering Journal, Vol. 45, No. 7, July 1962, p.33-37.
Note: This paper as well as some of the public domain references may be accessed electronically in PDF format at our website: www.pgatech.com.ph
1 Emilio M. Morales, MSCE took his Master of Science in Civil Engineering at Carnegie-Mellon University, Pittsburgh, PA. USA in 1980. He was employed as a Geotechnical Engineer at D’Appolonia Consulting Engineers. Currently, he is the Principal of EM²A Partners & Co. and concurrently serves as President for IGS Philippines, Chairman for the PICE Specialty Committee. He is a PhD Candidate at the Asian Institute of Technology, Bangkok, Thailand. 2 Mark K. Morales, MSc took his Master of Science in Civil Engineering at University of California – Berkeley, USA in 2004. He is the Technical Manager of Philippine Geoanalytics, Inc.