The tragic loss of life in the Cherry Hills landslide attracted a lot of media attention and with it a lot of speculations an rumors as to what caused the slide. Several professional organizations and government agencies were also involved in the various studies and investigations to understand what really happened. The Philippine Institute of Civil Engineers (PICE) and the Association of Structural Engineers of the Philippines (ASEP) banded together through a fusion of its Geotechnical committees to offer the services of volunteer members to investigate, document and come out with a factual report on what happened. This report summarizes the work of the committee, including the methodologies and tools employed in reconstructing the conditions before and after the landslide, its findings, conclusions and recommendation. Guidelines adapted from numerous sources are also included herein to help the Engineering community and the public in understanding potential hazards. It is not the intention of this committee to pinpoint responsibility or determine the culpability of any person or organization, public or private. This matter is best left to the courts to decide.
1 Chairman – PICE/ASEP Geotechnical Team Investigating the Cherry Hills Land Slide.
INTRODUCTION
The Investigation of Landslides presents a very interesting yet very difficult Challenge. It involves a more detailed understanding of the facts at hand in order to reconstruct what happened and how it happened. Unlike standard design projects involving slopes, where, the parameters and geometry are known as well as the anticipated environmental conditions, landslide investigations have to deal with a lot of unknowns and involves the formation of several assumptions of hypotheses which need to be tried out, studied, eliminated, validated and only then can conclusions be made and accepted. In the meantime, these assumptions need to be compared with the actual slide conditions to ensure that the theory and assumptions agree with each other, likewise be presented. Findings and conclusions on the results of the study will also be presented.
SLIDE NOMENCLATURE
The diagram illustrates a typical landslide and the components that make up the slide. (See Figure 1.0)
DATA GATHERING PROCEDURES
General
A slide event needs fast response if we need to ensure that critical evidences and telltales are not obliterated or further disturbed by rescue operations or by washouts or additional mudflows or debris flows. Thus it is important to mobilize the investigation team as fast as possible in order to gather as much information as possible before disturbances to the slide affected areas occur.
Field Reconnaissance and Site Interviews
The site reconnaissance is one of the most important field activities if done as soon as possible. A good site reconnaissance could record important data and information which otherwise could have been lost but which would be critical to a proper and adequate understanding of how the slide occurred and the mechanism involved. Interviews with the locals or residents in the slide affected areas is also very important in determining whether there were any telltale signs of an impending slide and what were the conditions immediately predecing the landslide event.
Aerial and Site Photographs
Particularly for slides of large extent, Aerial and site Photographs would be very valuable in establishing the extent of the slide and whether other slides could have been initiated by the main landslide event. Photographs could permanently record conditions at the site, which may not be readily apparent or could have been missed entirely in the initial walkthrough survey. Such visual records would prove invaluable in looking at several hypotheses.
Mapping of Extent of slide Geometry
The extent of the slide needs to be mapped approximately particularly very important if an aerial survey cannot be done due to limitations in time, budget or availability. The slide geometry may not be readily apparent in photographs but sketches and notes taken could sometime be very crucial to the understanding of the slide mechanism. Understanding the slide Geometry could also aid in guiding the analytical and computational approaches or tools that could be used to analyze the slide.
Study of the Geology of the Site and the Nature and Character of the Soil Deposits and Rocks
Understanding the Geology of the area is important in piecing together the various pieces of the puzzle. The following items need to be considered:
Orientation and dip of Bedding Planes
Manner and origin of deposition
Intensity of Jointing and fracturing in the case of rocks
Relic slides
Geochemistry of soils and rocks
Understanding the Environmental factors likely to have influenced the slide
Environmental effects causing destabilization almost always precede landslides. These is due to climatic, hydrogeologic, chemical and other natural environmental effects and changes, in addition to the artificial disturbances caused by man. A very dominant factor in the initiation of landslides is the sudden rise or lowering of the water table, which could induce the same effects.
An increase in the water content of soils or rocks, leading to saturation could reduce effective stresses and also cause degradation of fine-grrained soils. In addition, the original dry mass becomes heavier due to absorption of water and sliding follows particularly after prolonged heavy rains. Similarly particularly in dam embankments where sudden drawdown occurs, the saturated soil loses the buoyancy support from the water and thus slides downslope of the embankment.
ENGINEERING STUDIES
Reconstruction of Slope Geometry
Engineering plans or records of the preslide slope configuration normally would be available from the owners of the affected property for developed areas. In the case of Mountainsides or Natural terrain, the use of Topographic maps such as the NAMRIA series could be used to recreate the slope prior to the slide. Of course when developments or interventions by man are not recorded in plans or maps, the task of reconstructing the slope geometry prior to the slide becomes very difficult and would involve a lot of field measurements and surveys.
Subsurface Soil Exploration and Insitu Tests
Most often and particularly if no such investigation have been done in the past, subsurface borings would be needed to define the nature and character of the soil and rock deposits in order to determine with some degree of certainty the strength condition prior to failure. It is also important to know how the environmental factors have affected the original soil and rock condition.
Necessarily, the soil borings need to be performed in the slide zone to determine the vertical extent of the slide from detection of the extent of disturbance and residual strength and also at the unaffected areas to serve as a benchmark comparison.
Shallow test pits are also an inexpensive means to gather more information about the slide. These field tests would have to be supported by Laboratory testing to classify the soils and rocks and also determine their physical as well as Chemical properties. Geophysical methods such as Electrical resistivity logging and Seismic Refraction surveys could aid in establishing the true vertical extent of the slide by being able to discriminate between disturbed and undisturbed zones.
Analyses Procedures
After all data gathering is nearly complete, trial and preliminary back of the envelope calculations can be done and published nomograph could be used as a “first pass” analysis using simplifying assumptions. Once a general idea is formed more detailed Slope Stability using back-analyses procedures need to be started. As the name implies, back analysis is the reverse of a conventional Slope stability analysis. Because of the highly interactive procedures and computationally intensive tasks, this is best done using dedicated programs. The procedure begins by assuming first a homogeneous soil or rock mass and determining the critical failure Surface (Lowest Factor or Safety) by assuming a set of strength parameters (c and phi) and setting the program to search for the most critical failure surface. (The one with the lowest Factor of Safety). Once the critical slip surface or surfaces is/are identified the following Back Analysis procedure takes place:
A set of strength parameters (c and phi) is assumed and an interactive search is made on the most critical slip surface by setting c constant and varying the value of phi until a factor of safety of 1.0 (impending slide) is obtained.
The value of c is then changed (increased or decreased) and a corresponding value of phi is solved iteratively to yield a factor of safety of 1.0.
The Family of paired values of (c and phi) normally would fit a straight line. This line defines the most probable value sets that could have been present immediately prior to slide initiation.
Of course it must be understood that this exercise has greatly simplified the search routine by assuming a homogeneous mass which would be unrealistic. However, this could also lead to an understanding of the failure mechanism, which could expedite the detailed analyses that follow. Additionally, this leads to a concept known as the “characteristic strength of the slope” which for lack of a better description is a grossly simplistic attempt at quantifying the overall strength of the slope material at slide inception. Knowing what this is could lead to a quantification of the other external factors that have more than likely contributed to the slide.
Use of Empirical Methods and Criteria by Studying Records of Landslides in the past
Empirical methods are also available to determine the most probable set of strength parameters at slide inception by comapring this with historial records of known slides where back analyses have been performed. In addition Bieniawski has provided an empirical procedure in determining the quality of Highly Fractured rocks by a term known as the Rock Mass Rating (RMR). Several authors have further extended the RMR, notably Hoek in order to quantify the strength of these fractured rocks by relating them to the RMR and other qualitative properties to come out with “m” and “s” parameters. These are then in turn substituted into the Hoek-Brown formulation of a curved Failure envelope using Mohr’s circle.
Normally, although not always, the two preceding procedures although independent of each other would find fairly acceptable agreement. Obtaining convergence allows the investigator to go into more detailed analysis by factoring in multilayered slopes with varying strengths, etc.
Factoring in Environmental Influences
The influence of external environmental factors likely to have contributed to the slide to any degree needs to be considered and factored in the detailed Slope stability analyses. These factors are:
Groundwater levels at time of slide
Amount of precipitation
Possible man-made disturbances
Performing the Detailed Slope Stability Analyses to Identify Candicate Failure Modes
Once the results of the two procedures agree to a fairly acceptable degree, a more detailed analysis can be undertaken factoring in all the factors that are likely to have influenced the slide. The detailed analysis may or may not probably represent the true conditions at slide inception. Nevertheless, its generation and the detailed and painstaking studies leading to it would invariably gain for the investigator a better understanding of the slide and attain a more solid foundation to rest on, compared to a study that suffers for lack of a detailed methodology and procedure and the absence of realistic and factual data.
Comparison of Results with Actual Post Slide Geometry
As the saying goes, the “proof of the pudding is in the eating”. Nowhere is this saying more evident than in this stage when the theoretical failure geometry is arrived at and compared or matched with the actual Failure geometry. It goes without saying that these two should match otherwise failure geometries and perhaps revised strength parameters need to be restudied.
CONCLUDING THE POST SLIDE INVESTIGATION
The post slide investigation does not end with the Preparation of Report on Findings and explaining what happened and how it happened.
The real value of the investigation is when it adds to the body of knowledge and contributes to the welfare of society by recommending steps to prevent future similar landslides. Identifying, the need for corrective works and remediation procedures is a critical component of any investigation report n order to prevent the initiation of future landslide from the unstable and weak geometry of the Relic of the slide. Means should be provided in order to stabilize the slide and prevent the formation of other slides in the disturbed areas.
Synopsis: Almost ten years ago today, a landmark Reinforced Concrete Building serving as General Headquarters for the Armed Forces of the Philippines was Burned for the Third Time. This paper discusses the Investigation, Design, Construction and Monitoring Procedures used in the Structural Rehabilitation. Extensive use of Computer Analyses and Design as well as Computer Aided Drafting (CAD) including computer generated 3D details of critical connections, other than speeding up the design process resulted in effective communication of Designer’s intentions in a timely manner to all concerned. The cost of rehabilitation, not to mention the preservation of the Historical Value of the Building and reduced time to occupancy led to the owner’s decision to rehabilitate rather than demolish and reconstruct this Building.
1. INTRODUCTION
The last fire at the AFP General Headquarters Building resulted in an Engineering assessment being commissioned by the client to determine the viability of further rehabilitation efforts and to determine the integrity of the various Structural Elements that were involved or exposed to the Fire. Our office was retained to undertake this study and was subsequently engaged by the owner to undertake the Detailed Engineering needed for the rehabilitation and structural upgrading of the whole Building.
This paper discusses the steps and procedures undertaken by this office from the start of the investigation, to the Detailed Analysis and Design Engineering and the inspection and monitoring during the construction.
2. ENGINEERING BACKGROUND
2.1 Investigation Phase
The Investigation Phase was done over a Three (3) month period in 1988 culminating in the submittal of a report which concluded that although major repairs would be needed, the Historically Valuable Building could be saved despite three fires and two rehabilitations, without demolishing the Historical Facade (Figure 2) which was the focal point of the whole General Headquarters Complex of Camp Emilio Aguinaldo, the Headquarters and Administrative complex of the Armed Forces of the Philippines.
2.2 Methodology
The investigation study required destructive and non-destructive tests. Numerous cores were extracted in suspect concrete after numerous Rebound Hammer Tests were performed to indicate the location of relatively weaker concrete. In addition, steel reinforcement was extracted for tensile tests in some areas to serve as bases for our subsequent Structural Analyses and Investigation.
Reinforcing bars were exposed at critical structural sections such as at Beams, Girders, Column and Slabs to determine spacing and sizes of reinforcing bars for the existing structure. Fortunately, Plans of the First and Second Rehabilitation Programs were still available and were verified to be relatively accurate except in some instances, for which field changes were required during the ongoing rehabilitation. The rehab programs undertaken prior to this study involve buildup in concrete members one on top of the other for affected areas.
2.3 Results of the Investigation
From the results of the numerous rebound hammer readings undertaken, it was already evident that there were large disparities in the strengths of the two concrete layers. Figure 3 shows the existing configuration before rehabilitation.
The lower layer for Beams and Girders is composed of what we now term as the “original” concrete used in the original construction and the “rehab” concrete on top and integrated with the R.C. Slab used in the first and second structural rehabilitation. The original concrete on the underside showed very low concrete strengths, often preventing extraction of intact cores. Evidently, the original concrete in both Wings had been affected by exposure to Fire as borne out by the rebound hammer tests, the core extraction and subsequent tests on the intact cores.
Figure 4 is a chart of the results of Unconfined Compression Tests on intact cores. Of the more than 78 cores extracted, all of the low concrete strengths (below fc’=2500 psi) were obtained on the original concrete. Zero strengths represented concrete cores which disintegrated during extraction mainly from the original concrete.
All of the later rehab concrete showed consistently high concrete strengths averaging approximately 3500 psi. These results were predicted and anticipated by the numerous rebound hammer tests before the corings were performed.
From the foregoing, we were able to make the following conclusions:
The original concrete used in the original building construction was of relatively lower strength compared to more recent Rehab Concrete. This is probably due to the following:
The original concrete had been subjected to at least two previous fires, thus damage was progressive.
Poor quality concrete was used in the original construction.
The original concrete would pose a danger to building occupants if left in its existing condition.
Newer “Rehab” concrete although being subjected to the same fire exposure during the last fire has been relatively unaffected by it.
There was no need to totally demolish or condemn the Building and only structural strengthening of the historically important Building would be required to restore it to its former function.
The strengthening and rehab measures to be implemented, would also be directed towards upgrading the structural performance of the Building and bring it up to Present Day Seismic Code Design Standards.
Other than the foregoing which were purely of technical nature, the decision to go ahead on the structural rehabilitation was also dictated by practical reasons which weighed heavily in favor of rehabilitation rather than outright total demolition and reconstruction.
The practical considerations are as follows:
The cost of structural rehabilitation is approximately thirty four percent (34%) of the cost of a totally new Building with the same floor area.
Based on the winning bid, the cost of the Civil/Structural Works for the rehab scheme amounted to only one third of the cost per square meter for the demolish/construct scheme.
Time – Time to occupancy would be greatly shortened from a minimum of eighteen (18) months for a demolish/construct scheme to about five (5) months for the rehabilitation scheme eventually adopted.
Historical Value -There was a need to preserve the historical value and architectural details of the Building.
3. ENGINEERING ANALYSES AND DETAILED DESIGN
Several findings and engineering decisions were made during the structural analyses and detailed design stages as follows:
The Preliminary Structural Analyses showed that the existing structural system even without the effects of the fire would be inadequate to sustain Seismic Lateral Forces.
The existing details, even for the rehabbed portion, will not comply with Seismic Detailing Standards for Zone 4 existing at the time as mandated by ACI 318-83 and the National Structural Code of the Philippines and therefore structural strengthening would be necessary.
In the structural analyses, the contribution of the original column core concrete was entirely neglected and the new column was idealized as a Hollow or Box Column enclosing the original concrete core. A specific custom program was developed in-house to analyze the hollow column and generate column interaction diagrams for various cases of loading.
3-D Computerized Frame Analyses were conducted. The East Wing, West Wing and Central Core were idealized as independent structures because of the provision of a Seismic Joint in the original construction. The subsequent strengthening details also preserved this Seismic Joint.
The rear portion of the Central Core was totally demolished and replaced by a new structure integrated with the existing core. This was necessary as this part was still supported on Timber Flooring during the last fire and relatively was more severely damaged.
On the basis of the analyses results, a Reinforced Concrete Seismic joint detailed to existing Code was found adequate. The most important feature of this detail is the provision of additional Vertical Reinforcing bars through the joints to provide for continuity. Confining ties were placed in addition to the confinement by additional rehab concrete on the Beams and Girders meeting at the joint. (See Figure 5)
The horizontal beam and girder bars were in turn confined within the column vertical bars. The illustration of Figure 6 shows the Rehab Scheme adopted for the Beams, Columns and Slabs.
It is important to note here that although the East Wing Columns have been earlier rehabilitated after the previous fires, it was still necessary to provide for additional vertical reinforcing bars through the joints to be confined with closely spaced ties as the existing details were found to be inadequate. Again, in the Structural Analyses of this system, the existing core concrete and reinforcing bars were neglected thus imparting a far bigger “Factor of Safety” in reality.
Negative moments for the existing Beam and Girder needed additional reinforcement for continuity and also to increase lateral load resistance. Additional reinforcing bars were also needed to increase positive moment carrying capacity.
The negative Bars were placed and confined within the new column vertical bars and new ties were integrated to confine the reinforcing bars as well as the positive moment reinforcing bars which were threaded in to the existing Beam hoops.
3.1 Computer Analyses and Design
The computer analyses and design was carried out using M-STRUDL, an enhanced microcomputer implementation of the STRUDL Software written in C Language which was popular at the time. In-house developed software for the analysis of the Hollow or Box Column was used as earlier stated as well as spreadsheet programs for generating column interaction diagrams.
4. REHABILITATION PROCEDURES
4.1 General
Great emphasis was placed on the value of effective bonding between the old and new concrete requiring the use Structural Epoxy Bonding agents. In the process, stringent surface preparation procedures were required to ensure the effectiveness of the Bonding.
We assigned a Senior Structural Engineer on full time basis to monitor and ensure that surface preparation and epoxy application are carried in accordance with the specifications and to oversee rehabilitation in general.
In addition to this, detailed structural rehabilitation procedures were included as part of the plans and specifications to set the minimum basis for rehabilitation. This included outline or step by step procedures for chipping, demolition, surface preparation, epoxy application and reinforcing bars installation. In order to forestall any misinterpretation of Plans and Specifications, the Contractor was required to submit a detailed construction methodology for acceptance and approval by the owner through the consultant. This requirement identified a lot of areas that were overlooked during the bidding stage and was very invaluable in this regard as it enabled the owner and engineer to check the Contractor’s intentions and directions for the rehab even before fieldwork started. Revisions and changes in the methodology were made in the course of construction, nevertheless, this requirement helped immensely in identifying possible problems during the implementation.
4.2 Computer Aided Drafting and Detailing
Three Dimensional (3D) drawings and reinforcing bar layouts as in Figure 6 & 7 were prepared to ensure that the intended reinforcing bars details were faithfully carried out in the field by the Contractor. Extensive use of CAD to generate 3D Plots were made. The extent of detailing required and implemented using CAD would defy manual efforts, given the time pressure. Thus, the decision to fully utilize our CAD Graphics facility which was still relatively crude at the time, to support the project and generate 95% of the drawings proved to be a wise one and was effective in ensuring a clearer understanding of the complicated reinforcing bars layouts. In addition, changes necessitated by unforeseen field conditions could be done easily by just revising the electronic files.
4.3 Detailed Rehabilitation Requirements and Procedures
Based on the findings during the investigation phase, it was decided that all original Beam and Girder concrete would have to be removed and replaced as this could fall off or spall off during an Earthquake. Because of the adequacy of the later rehab concrete for the Slabs and Top portions of Beams and Girders, it was decided to retain and integrate these with the new rehab concrete. This was a major cost saving. The existing columns’ concrete cover would have to be removed to expose the old reinforcing bars and a new rehab concrete and reinforcing bar cage were installed to envelope this core concrete. Vertical column reinforcing bars as well as Beam/Girder negative bars and positive moment bars were made continuous through the joints and confined with Hoops and Ties in accordance with ACI 318 and 315. Extensive use of shoring was specified and required as early as the bid stage in all instances to prevent any movements in the Building Frame during rehabilitation when it was very vulnerable.
Due to the fragile and weakened nature of some elements, the use of heavy Pneumatic Jackhammers was prohibited and only small hand held rotary air hammers and bush hammers were allowed to be used to demolish the original concrete. Vibrations during construction operations was carefully avoided and extensive use of shoring was required.
The existing original reinforcing bars for Beams, Girders and Columns were retained and integrated with the new rehab reinforcing bars and concrete. This in a way compensated for the setting up of creep/shrinkage stresses affecting the structural elements due to the bonding of the old and new concrete.
4.4 SURFACE PREPARATION
The original concrete cover was chipped off (Figure 9) to expose the existing reinforcing bars. Cleaning of the reinforcing bars proceeded immediately using a wet type sand blasting equipment until all the reinforcing bars were to bare white metal finish.
High pressure water spraying (Figure 8) was used immediately before epoxy application in order to remove all loose and defective concrete and for final cleaning of reinforcing bars. This utilized a 6,000 psi (41.3 Mpa) High Pressure washer. The quality of bonding surface and rough texture was assured by this final surface preparation procedure.
The tight spaces and reinforcing bars cages required epoxy application by hand brushing. It was therefore necessary to require that the epoxy would have an adequately long “overlay time” of at least six (6) hours to allow application, erection of forms and pouring of concrete. This requirement meant that the forms would have to be collapsible and allow for easy installation. Prefabricated laminated plywood forms were specified to eliminate the need to refinish the stripped surfaces.
4.5 CONCRETING
It was necessary to pour the concrete columns in two lifts with the last lift being poured monolithically with the upper Beam Column joint (Figure 10). Maximum 3/8” (9.5mm) aggregate was specified to ensure that the congested areas are effectively filled by concrete. Breather holes were punched in the slabs to prevent entrapment of air that could block the flow of concrete. Very small diameter hand held electric Driven Pencil Poker Vibrators were utilized in most instances due to the tight spaces involved. The Concrete Mix required the use of a plasticizer because of the low water cement ratio (0.42) required on top of the minimum guide specification of fc’=4000 psi (27.6 Mpa) Concrete Cylinder Compressive Strength. The low water cement ratio was required to reduce shrinkage to a minimum. Wet curing of the poured concrete elements also helped to reduce shrinkage. The more than liberal distribution of new and old reinforcing bars in a way prevented shrinkage movements that would have otherwise caused concrete to crack.
4.6 Construction Methodology
Unlike conventional construction projects, this rehabilitation project is unique in that rehab work can be started in almost all areas. However, due to priorities dictated by owner requirements and in order to further speed up the project, the contractor was required to adhere to a priority schedule which among others required completion of the roof within 40 days from award of contract. Completion of the roof would have allowed an all weather construction although extensive shoring would have been required.
Additionally, the rehab procedures dictated that no two adjacent columns would be rehabbed simultaneously so as not to unduly weaken the Building. The soundness of this requirement was amply proven during the July 16, 1990 Luzon Earthquake which registered Intensity 7.7 in the Richter Scale.
REFERENCES
ASEP (1992) National Structural Code of the Philippines Volume 1. Association of Structural Engineers of the Philippines (ASEP), Manila.
ACI (1996) ACI Manual of Concrete Practice Part 3. American Concrete Institute (ACI), Farmington Hills, Michigan.
ABOUT THE AUTHOR
Emilio M. Morales, MSCE took up his masters degree at the Carnegie Institute of Technology, Carnegie-Mellon University, Pittsburgh, PA. USA in 1980. Formerly Senior Lecturer of Graduate Division, College of Engineering, University of the Philippines, Diliman, Quezon City. Presently, he is the Technical Manager of Philippine Geoanalytics, Inc., Civil Engineering Laboratory and Principal of EM2A & Partners & Company. Committee Member, TC-11, Bureau of Product Standards Technical Committee on Steel Products.
He can be contacted at: EM2A Partners & Co., No. 17 Scout de Guia corner Scout Reyes Streets, Diliman, Quezon City. Telephone Nos. 371-18-04 & 06/ 410-29-23 to 24. Fax No. 924-98-94; E-mail: em2apart@mozcom.com.
Abstract: Testing of Fresh and hardened concrete has become routinary. This “routineness” has led to blind acceptance of the results without a real understanding of what the test results are saying and only “PASS”/“FAIL” conclusions are made on such results. However, the tests tell us what is happening or what is bound to happen if we do not heed the telltale indications that the tests are trying to convey. Oftentimes, lack of understanding of the failure or the causative mechanisms that bring about such failures are the least understood leading to wrong corrective responses or solutions. Problem identification has been said to be 80% of the solution process. Thus, there is a need to know the factors and significance of each test and the variables involved in the tests in order to arrive at solutions that directly address the problems. Most of the contents of this paper was obtained from literature more specifically from the work by Klieger et al on “ ASTM STP 160C – Significance of Tests and Properties of Concrete and Concrete-Making Materials”.and downloads from the Internet. Nevertheless, the authors hope that this paper could lead to a fuller understanding of the significance of the tests and what the test results are really telling us.
1.0 INTRODUCTION
Testing of Concrete both in the plastic and hardened states need to be carefully understood in order that adequate responses or proper corrective measures can be made to developing problems even before these develop.
Oftentimes, the test results and what they tell the end user remain as merely test results because of a lack of understanding on what these test results are really indicating to us and how they could best be used or interpreted to result in adequate and timely corrective measures to address the problem.
This paper references work by several authors from an ASTM Special Technical Publication ASTM STP 160C on the work by Klieger et al on “Significance of Tests and Properties of Concrete and Concrete-Making Materials”.and downloads from the Internet.
2.0 CONCRETE BASICS
Concrete is defined in the ASTM terminology relating to Concrete and Concrete Making Materials (C-125) as:
2.1 A composite material that consists essentially of a binding medium within which are embedded particles or fragments of aggregates.
2.2 In Hydraulic-cement concrete, “the binder is formed from a mixture of Hydraulic cement and water”.
2.3 Hydraulic cement is defined (ASTM C-219) as “a cement that sets and hardens by chemical interaction with water and that is capable of doing so under water”.
3.0 COMPONENT MATERIALS
3.1 Portland Cement
Portland Cement is the primary constituent of Portland cement Concrete.
It is defined as gray, powdery material that meets ASTM Standard C 150 and is composed primarily of tricalcium silicate, dicalcium silicate, tricalcium aluminate, and tetracalcium aluminoferrite. When combined with water, Portland Cement reacts with the water to form a paste, which then becomes rigid as the reaction between the cement and water progresses. 3]
Combined with the other components such as the inert fine and coarse aggregates and water, the Portland cement reacts (Hydrates) with water, initially forming a paste which within hours hardens to form the binding medium or cementitious matrix that holds the aggregates together.
3.2 Water
Next to Portland Cement, Water is an important ingredient. Water controls the strength and workability of the mix. The water reacts with the portland Cement in a process known as hydration to form a cementitious paste that hardens with time. The hydration reaction is a complex chemical reaction which physically alters the character and properties of the original Portland cement.
The water cement ratio is a good approximate indicator of the probable strength of the hardened mix. Its control is essential to a proper mix design which will address the job requirements.
Too much water in the mix will:
Cause large shrinkages to occur if concrete is allowed to cure normally
Result in low strengths
Increased workability and flowability
There are real Reasons to use less water and these are to accomplish the following objectives:
Increased strengths
Lowered permeability
Increased resistance to the effects of weather
Better bonding with reinforcement
Less volume change from wetting and drying
Increased resistance to plastic shrinkage
If strength requirements as well as workability demands need to be met concurrently, addition of water while increasing workability can cause a retrogressive effect on the strength and increases shrinkage potential and should thus be avoided. Reduction of water in the mix would increase strength but may make the Concrete unworkable.
An alternative would be to consider the use of superplasticizers which dramatically enhances the workability and flowability of concrete while reducing the water demand and thus results in a concrete mix that will address the requirements of the project for strength and workability.
3.2.1 Water/Cement Ratio
The water/cement ratio is the weight of the total amount of water relative to the weight of the total amount of cement used per cubic meter of concrete. In simple terms, the lower the water/cement ratio or the less water used for a certain weight of paortland Cement in the mix, the better the concrete. This is true to a point. Enough water is needed to be able to place and consolidate the concrete as well as achieve complete hydration reaction.
The binding quality of the cement/water paste is due to the chemical reaction achieved when water is mixed with cement.
This reaction is called hydration. Very little water is needed for hydration. In fact, most concrete would look like a pile of rocks and be unworkable if the only water added was to hydrate the cement. Most of the water in concrete is “water of convenience” to help ease the task of placing concrete.
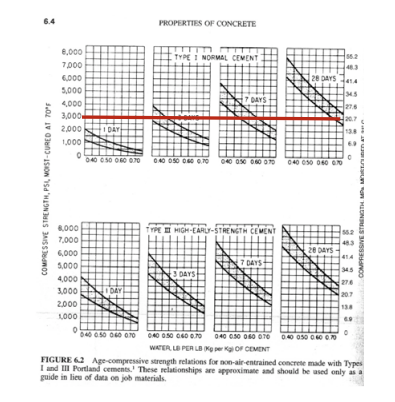
The more water added to concrete the thinner the paste. The thinner the paste, the less strength in the hardened concrete. The Portland Cement Association suggests using no more water than is absolutely necessary to make the concrete plastic and workable. The graph below shows the effect of the Water Cement Ratio on the the Compressive Strength of Normal Weight Type I Portland Cement concrete at varying times based on tests on American Portland Cement Concrete. 4
Fig 3.2.1 Age vs Compressive Strength for various Water Contents
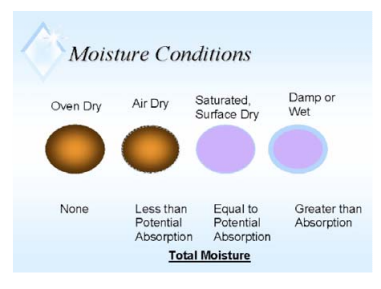
3.2.2 Water in Aggregates
Water in aggregates may or may not contribute to the hydration water depending on the condition of the moisture in the aggregates.
Fig 3.2.2. Moisture content in Aggregates for different conditions.
Water in the aggregates may also increase the available water as to increase the water cement ratio.
Thus, tests to determine the Moisture content of the aggregates is necessary for mix design purposes. The condition of the aggregates during the moisture content determination is also important as it determines whether the water is available as free water that could increase the water content of the mix or not at all. By the same token, it is necessary to determine the absorption capacity of the aggregates to determine whether hydration water will be reduced by absorption of the aggregates. Essentially, the absorbed water is not available to react with the cement as hydration water. Knowing the absorbed water will allow us to compensate for mix water that is “robbed” by aggregate absorption.
Normally aggregates are tested for absorption by using “Saturated Surface Dry Condition” as it is a measure of the potential absorption when moisture content under SSD is determined by Oven drying. the moisture content determined is then used to determine the absorption loss.
3.3 Air Content
Air content measurement is important particularly for non air entrained concrete because unexpected increases in air content can have a retrogressive effect on compressive and flexural strengths. The entrapped air bubbles displaces the cement matrix thus reducing the strength to some extent.
In tropical climates, air entrainment would normally only be prescribed for marine exposures for increased resistance to water permeability but more and more, this is being replaced by fly ash to provide a denser less permeable mix. However, even in the country, air entrainment for protection of the concrete (and eventually the rebar from corrosion) is done by using Fly Ash to promote a denser packing with minimum of voids in the concrete. The microfine fly ash fills these voids while at the same time increasing mobility and allowing for strength increases although in a much more delayed setting time.
3.4 Fine & Coarse Aggregates
3.4.1 Gradation Tests
Test of fine and coarse aggregates for grain size distribution is known as a Gradation test.
Grading is the particle distribution of granular materials among various sizes. This is usually expressed in terms of cumulative percentages larger or smaller than each of a series of sizes of standard sieves.
Grading and particle size distribution affects the overall performance of concrete as follows:
Determines the relative aggregate proportions
Determines the cement and water content
Affects Workability
Durability
Porosity
Porosity
Shrinkage
The well graded the particles, the more economical is the mix. a well graded aggregate means that all the grain sizes are represented. This allows for economical, denser concrete mixes with increased strength.
Variations in grading from batch to batch can affect the uniformity of concrete.
Generally, aggregates which do not contain a large deficiency or excess of any particular size and give a smooth gradation curve, within the prescribed gradation will produce a satisfactory mix.
Providing a well graded gradation (where all prescribed particle sizes are present) will reduce the total volume of voids which otherwise will be occupied by the cement paste.
An air meter is normally used for measuring air content.
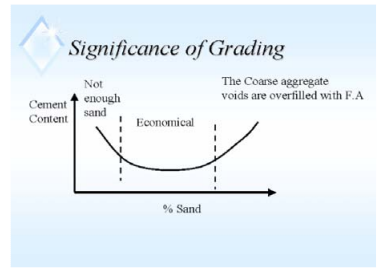
Fig 3.4.1.1 Cement Content vs % Sand Content illustrating the Significance of Sand Content to the
overall economy of the Mix expressed in terms of Cement Content demand
The Chart above shows that control of Sand content to within the prescribed guidelines will result in an economical mix. Too little sand would result in a very harsh mix and would require cement to be used as voids filler. Too much sand captures the cement paste to coat the individual grains resulting in increased cement demand.
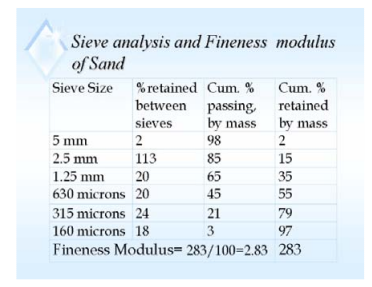
For fine and coarse aggregates the fineness modulus (FM) is defined by ASTM C-125. The fineness modulus is obtained by adding the cumulative percentages retained (by weight) on each of the specified sieve sizes and dividing the sum by 100.
The higher the FM, the coarser is the aggregate.
Fig 3.4.1.2 Fineness Modulus Calculation for Fine Aggregates
FM is important in estimating the proportions of fine and coarse aggregate.
3.4.2 Coarse Aggregates
The strength of aggregates, and hence its influence on the concrete, is primarily dependent on its mineralogy.
Beyond this, a smaller sized aggregate may have strength advantages in that internal weak planes may be less likely to exist or would be smaller and discontinuous.
The bond between mortar and coarse aggregates will be stronger for smaller aggregates.
A rough angular surface such as in crushed aggregates will increase the bond strengths.
As the maximum size of aggregate is increased for a given slump, the water and cement content per cubic meter of concrete are decreased. The larger the coarse aggregate proportion is in the total mix, the lesser is the cement needed due to the lesser surface area compared to smaller aggregates. However, workability is affected and the mix becomes harsher with increasing aggregate size.
Flat elongated and angular shapes require more water to produce workable concrete. Hence, cement demand is increased to maintain the same WC ratio.
The larger the aggregate size, the lesser is the cement demand.
For coarse aggregates, the larger size materials tend to affect the strength of concrete particularly if the aggregates have weakened planes or discontinuities. Gap graded aggregates may sometimes be used because of deficiency in coarse aggregate sizes within a certain sieve series. This would still be acceptable provided the percentage of fine aggregates is controlled. Gap graded mixes can produce a harsher mix but adequate vibration may address the problem.
Segregation is a problem in gap grading and therefore over vibration is to be avoided and the slump limited from 0 to 3 inches.
3.4.3 Fine Aggregates
Sand is primarily a filler for the voids in concrete.
Increasing the proportion of sand in the total mix increases cement demand because of the relatively very large surface area that needs to be coated by cement paste.
Flowability and mobility of concrete is enhanced with larger sand proportions but increases cement demand.
Flat elongated and angular shaped sands such as products from crushed sand, also require more water to produce workable concrete. Hence, cement demand is increased to maintain the same WC Ratio.
Generally, the gradation for fine aggregates given by ASTM C-33 would be adequate. However, it would be preferable to limit the % passing for the two smallest sieve sizes (#50 and #100 to 15% and 3% or more respectively. This would depend on workability during placement. The higher the fines content the more workable is the concrete but also increases cement demand.
4.0 FRESH CONCRETE
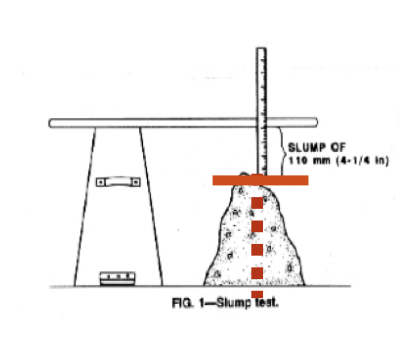
4.1 SLUMP TEST
The slump test is a measure of the workability of fresh concrete. It should NOT be used for predicting strength even in an approximate way.
Fig 4.1 Diagram of the Slump Test showing how Slump is measured
4.1.1 Additional Information from the Slump Test
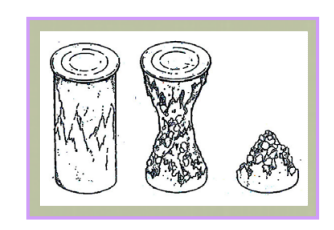
More information can be obtained from the Concluded Slump Tests as follows:
After removing the slump cone and measuring the slump, the concrete is tapped on the side with the tamping rod.
Two concretes with the same slump may behave differently as follows:
One may fall apart after tapping which indicates that it is a harsh mix with a minimum of fines. This may have sufficient workability ONLY for placement in pavements or Mass concrete.
Another may be very cohesive with surplus of WORKABILITY, this may be required for more difficult placement condition
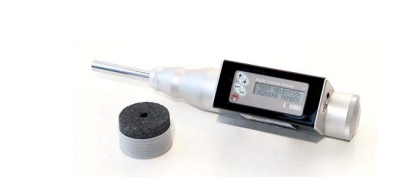
4.2 The Schmidt Rebound Hammer
The rebound hammer is an impact device that indicates relative and approximate concrete strength QUALITATIVELY through the rebound of the probe which has been calibrated against concrete strengths.
It is useful in determining or locating weaker or stronger concrete qualitatively and in a relative sense or for locating areas with discontinuities and honeycombs.
It is not an accurate device even when calibrated against concrete cores extracted in the area and is not intended to replace the compression test. It should NOT be used as a basis for acceptance or non-acceptance of a particular pour.
Fig 4.2 The Schmidt Rebound Hammer with Digital Readout and Polishing Stone.
The device when used properly could give useful indications such as to where weaker vs Stronger concrete is present but only in a relative sense.
A lot of consultants think that it is an accurate and absolute determinant of Concrete compressive strength which it is not. Dependence on this as the sole reference and basis for rejection is unwarranted, unsound and NOT VALID.
4.3 Test on Concrete Core sample
Whenever the strength of hardened concrete is put to doubt, destructive testing in the form of testing concrete core samples uniaxially in accordance with ASTM C-42 is performed on the area where the questionable concrete has been laid. Coring is done using Diamond Coring bits that are thin walled. The core diameter should be no smaller than three times (3x) the size of the maximum nominal size of coarse aggregate.
Where possible, the length of the core should be at least twice the diameter (2X) of the core but other height to diameter ratios are permissible to a certain extent and corresponding correction factors are applied to the test results to compensate for the slenderness of the core sample. Reinforcing steel should not be included in the cores to be tested. If rebars do exist, the cores would have to be discarded and replaced.
When cores are taken for the purpose of strength determination, at least three cores should be taken at each location. The strength of the concrete as cored is expected to be lower than the design strength to take into account disturbance and damage effects during the sampling and testing of the cores. Values approaching 0.85 of the design concrete strength f’c or higher would be generally acceptable. 5 ]
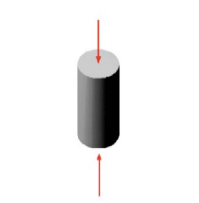
4.4 Concrete Compression Test ASTM C-39
A concrete test as technically defined should consist of tests on at least two standard cylinders taken from the same batch or pour.
4.4.1 ACI Requirements for Compressive Strength Test
For a strength test, at least two standard test specimens shall be made from a composite sample obtained as required in Section 16. A test shall be the average of the strengths of the specimens tested at the age specified in 4.1.1.1 or 4.4.1.1 (Note 19). If a specimen shows definite evidence other than low strength, of improper sampling, molding, handling, curing, or testing, it shall be discarded and the strength of the remaining cylinder shall then be considered the test result.
To conform to the requirements of this specification, strength tests representing each class of concrete must meet the following two requirements mutually inclusive(Note 20):
The average of any three consecutive strength tests shall be equal to, or greater than, the specified strength, f’c, and No individual strength test shall be more than 500 psi [3.5 MPa] below the specified strength, f’c.
4.4.2 Failure Mechanism
Concrete failure in the compression test or in service is a result of the development of microcracking through the specimen to the point where it can no longer resist any further load.
The crack propagates through the weakest link whether it is through the aggregates or the cement matrix or both.
For ultra high strength concrete aggregate strength becomes critical and it would be better to have smaller sized aggregates so that internal weaknesses in the aggregates would not be significant as a crack initiator. Also, the use of small sized aggregates increases the aggregate interlock and increases the chances for Crack Arrest.
For normal strength concrete, failure normally propagates through the cement matrix unless internal planes of weakness in the aggregates give in more readily but the random distribution of these would arrest such crack propagation in the normally stronger aggregates.
In the compression test, because of scale effects, the planeness, perpendicularity and surface imperfections critically influence the results.
4.4.3 Factors Affecting Compressive Strength
Retempering of the mix with water in the concrete can cause a decrease in the mortar strength due to uneven dispersion of the retempering water which leads to pockets of mortar having a high water cement ratio.
If concrete is allowed to dry rapidly, the available moisture for hydration reaction will be reduced and hydration ceases.
A smaller sized aggregate may have strength advantages in that the internal weak planes may be less likely to exist.
The bond between the mortar and coarse aggregate particles will be stronger for smaller sized aggregates which have a higher curvature.
When concrete bleeds, the bleed water is often trapped beneath the coarse aggregate thus weakening the bond within the interfacial zone and allowing for weaker stress paths for cracks to initiate. Excessive bleeding will produce a high water cement ratio at the top portion leading to weakened wearing surfaces and dusting.
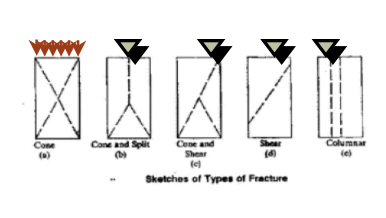
4.4.4 Break Patterns
Surface imperfections in the sample or the test platform can cause uneven break patterns which signal lower strength results normally.
Fig. 4.4.4 Uniaxial Test on Concrete Cylinder ASTM C-39
4.4.5 Factors Affecting the Compressive Strength Test Results:
Specimen geometry Size End conditions of loading apparatus Rigidity of Test Equipment Rate of load application Specimen moisture conditions
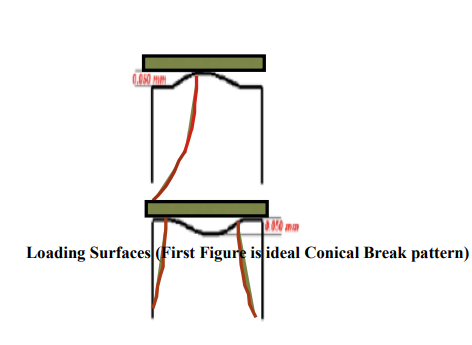
Fig. 4.4.5a Ideal Break Pattern is Conical and Hour Glass ShapedFig. 4.4.5b Some Break Patterns Due to Uneven
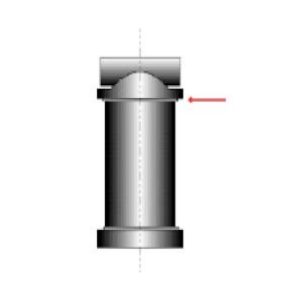
The purpose of specifying end condition requirements of planeness and perpendicularity is to achieve a uniform transfer of load to the test specimen.
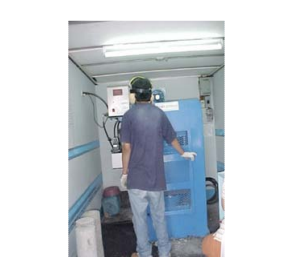
Fig 4.4.5c Conventional Compression Tester on Mobile Testing LaboratoryFig 4.4.5d Spherical Platen ensures that the load is transferred evenly to the Concrete CylinderFig. 4.4.5e Surface Deformities result in uneven load Distribution causing premature Test Failure = Fictitious Low Strengths.Fig. 4.4.5f A High Capacity UTM for Testing Ultra High Strength Concrete Cylinders
Non-conforming specimens generally cause lower strength test results and the degree of strength reduction increases for higher strength concrete.
4.4.6 Specimen Size and Aspect Ratio
The ASTM Standard test specimen is a 6” Diameter x 12” high cylinder.
Compressive strength generally varies inversely with increasing cylinder size with the 6” dia cylinder as the reference size.
The ratio of specimen diameter to max aggregate should be 3:1, the accuracy of the strength test results decreases as the diameter to aggregate ratio decreases.
The L:D (aspect ratio) requirements is 2. The strength increases with decreasing L/D ratio due to end restraint. However, correction factors are allowed.
4.4.7 Requirements of Testing Machine Properties
The Test Equipment used for the Compression test :
Must be capable of smooth and continuous load application.
Must have accurate load sensing and load indication.
Must have two bearing blocks one fixed and the other spherically seated both satisfying planeness and rigidity requirements.
Distortion of testing machine or of the bearing plates due to inadequate rigidity can cause strength reductions therefore, adequate rigidity needs to be assured.
4.4.8 Rate of Loading
ASTM C-39 requires that the loading rate for hydraulically operated test frames be controlled to within 20 to 50 PSI or about 500 Lbs per second. Other than making the test procedure follow consistent rates of loading and thus remove this as a variable effect on Concrete Strength, there are other reasons for prescribing a constant rate of loading.
The apparent strength of the concrete increases with increasing loading rate and therefore the loading rate must conform to the required standard to produce consistent and accurate results.
Higher strength concrete are more affected by the loading rate.
This dependence on loading rate has been found out to be due to the Mechanism of creep and Microcracking.
Thus, it has also been found out that when subjected to a sustained load of 75% its ultimate strength, concrete will eventually fail without any further load increases.
4.5 Concrete Flexural Strength
4.5.1 Factors Affecting Flexural Strength Test Results
Specimen Size Preparation Moisture Condition Curing Where the beam has been molded or sawed to size Aggregate Size
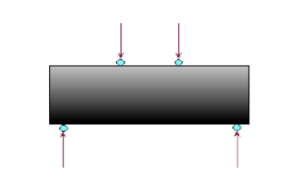
Fig. 4.5.1 Flexural Test on Concrete
5.0 CONCRETE SHRINKAGE
Concrete shrinkage is primarily due to rapid and uneven loss of water. Therefore, improper curing of Freshly poured concrete and control of environmental factors plays a key roll in shrinkage control.
Drying Shrinkage increases with increasing water content. Therefore control of mixing water to that required only for complete hydration and desired adequate flowability is important. In case such conditions can not be met, it would be better to achieve these requirements by using water reducing plasticizers rather than by addition of more water.
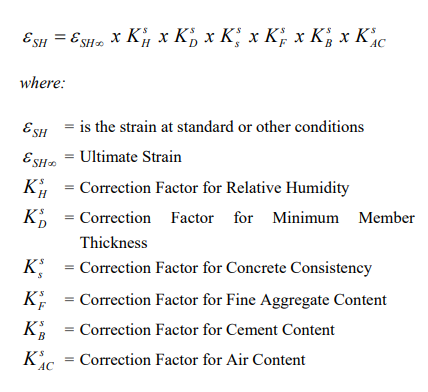
Although control of total water in the mix is the primary objective to control shrinkage Cracking, other factors contribute to the overall shrinkage cracking as the following Equation would suggest.
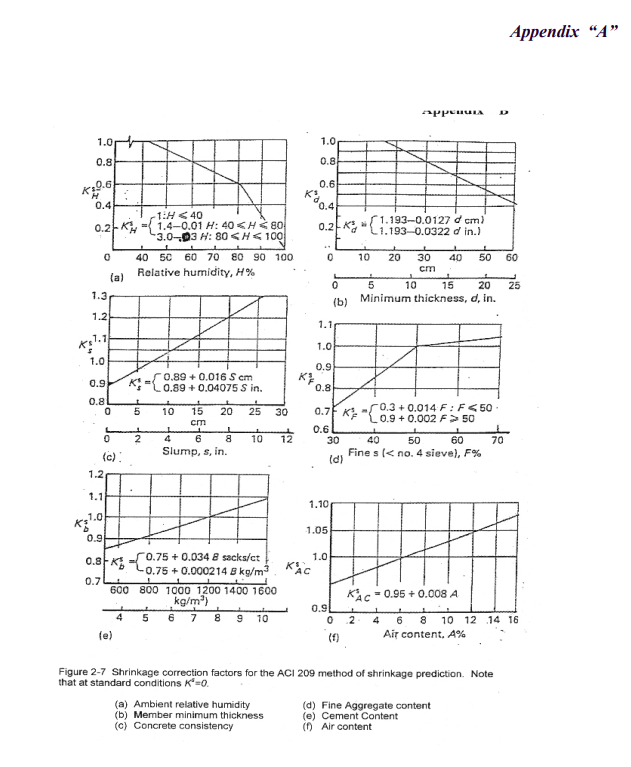
Shrinkage cracking can be quantified or predicted based on ACI 209R-92 procedures as given in the following formula below. What is significant to note in this Formula is the contribution of other factors to the overall shrinkage magnitude which are controllable and thus points the way to the reduction of Shrinkage effects.
Prediction of Actual Shrinkage Values based on ACI 209R-92
Concrete shrinks due to moisture loss. However, the actual magnitude of ultimate shrinkage is dependent on a lot of factors as contained in ACI 209R-92.
These factors are:
Relative Humidity
Minimum Thickness
Cement Content
Slump
Air Content
Fines Content
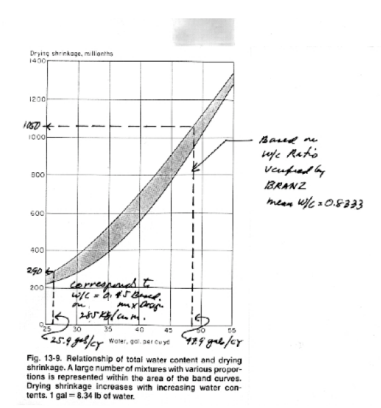
The parameter SH is obtained from the Chart below which is dependent on the Total Water Content of the mix when laid. The chart for obtaining the above variables are given in the Appendix of this paper.
Fig. 3.2.1.2 Shrinkage Values in Millistrain vs Water Content
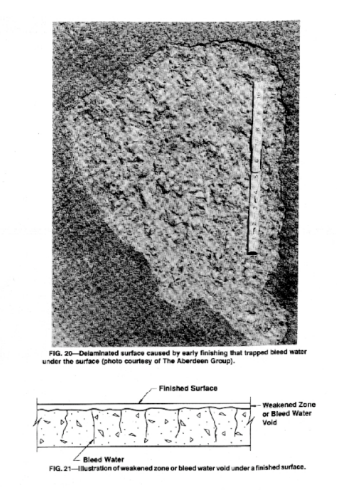
6.0 BLEED EFFECTS
Although not related to shrinkage, bleeding is A related surface defect that is controllable. Bleeding occurs when over-troweling happens which works up more water to the surface.
The increased water at the surface results in higher W/C which causes a low strength layer that can delaminate and cause dusting or powdering.
7.0 CONCLUSIONS
This paper has identified the various Factors affecting tests on fresh and hardened concrete and their significance in influencing test results.
A complete understanding of these Factors can definitely reduce uncertainties in determining the cause/s of “Failed test Resultsˆ and eliminate costly Guesswork and often times solutions that do not address the problem.
The Authors hope that recognition of the various factors that influence the test results could lead to a more positive and responsive solution to problems brought about by the test results.
REFERENCES
Klieger, Paul and Lamond, Joseph F. “Significance of Tests and Properties of Concrete and Concrete- Making Materials”. ASTM STP 160C.
ACI 209 R -92 METHOD OF SHRINKAGE PREDICTION.
1 Emilio M. Morales, MSCE took his Master of Science in Civil Engineering at Carnegie-Mellon University, Pittsburgh, PA. USA in 1980. He was employed as a Geotechnical Engineer at D’Appolonia Consulting Engineers. Currently, he is the Principal of EM²A Partners & Co. and concurrently serves as President for IGS Philippines, Chairman for the PICE Geotechnical Specialty Committee. He has been elevated to PhD Candidacy at the Asian Institute of Technology, Bangkok, 2 Mark K. Morales, MSc took his Master of Science in Civil Engineering at University of California – Berkeley, USA in 2004. He is the Technical Manager of Philippine Geoanalytics, Inc. and President of PGA Earth Structures Solutions
3 www.ces.clemson.edu/arts/glossary.html
4 NOTE: Slightly Lower results are obtained for philippine Cements due to lower cube compressive strengths but the chart is indicative of the relationship between Concrete Strength and W/C
5 ACI 437R-16 “Strength Evaluation of Concrete Buildings” Excerpts
Download Significance of Tests on Fresh & Hardened Concrete
Very often the Earthworks Contractor is confronted with a clear set of specifications from the Design Engineer outlining specified compaction density, moisture content and governing standards. In most instances, the contractor innocently and faithfully tries to carry out the procedure in the field without a clear understanding of what is really required and without a fundamental understanding of the Soil Mechanics principles entailed in such a “simple” task as Earthwork construction. This ignorance and oversimplification often produces disastrous results, delays in the project and financial loss to the contractor. Unfortunately, it is sometimes not only the contractor but also the Design Engineer who is ignorant of these principles, thus confounding the problem which could again further cause delays in the project. What is also dishearthening is the realization that all too often this “failure” on the part of the contractor results in countless litigation or delays because the real problem could not be identified.
The statement “problem identification is Eighty Percent of the solution” is nowhere very applicable as in this problem.
Let us consider several cases which highlight what we mean:
1.1 Runway Construction Project
A very large runway project inside a U.S. Base required a minimum of 95% of Maximum Dry Density based on ASTM D-1557 (Modified Proctor) on the subgrade which consisted of Clean Coarse Grained Materials (Granular Sand).
The contractor proceeded to do the compaction utilizing about 20 units of large Vibratory Rollers and Two (2) Water Trucks.
We were hired as the Independent Q.C. Laboratory to monitor Field Compaction. The contractor almost consistently had very large number of Field Density Test “Failures” despite numerous passes (about 10 to 12) per lane.
We were asked to look into the problem as substantial delays have been incured without significant progress. After conducting compaction trials on a 100 meter strip for half a day, we were able to achieve adequate compaction in just 3 passes!
The procedure we used in the compaction trials was immediately implemented which resulted in almost halving the vibratory compactor fleet (rented) but increased the number of water trucks to 4 at tremendous savings to the prime contractor. This also enabled the contractor to accelerate subgrade preparation by at least two (2) months.
What happened was not black magic but just the sound application of Soil Mechanics principles as we shall see later on.
1.2 Housing Project at Subic
In a housing project inside the Subic Naval Base, an American Contractor was required by the contract specifications to compact the soil to 95% of Maximum Dry Density again based on ASTM D-1557. After several rectangular slabs for the duplex housing were poured and after a heavy downpour, two of the recently poured slabs broke neatly into two at the center.
We were called in to do consulting work to solve the problem and we found out that it was a swelling soil problem.
After the study and a long protracted fight with the U.S. Navy Engineers out of Honolulu, the Navy adopted our recommendation on the basis of a “no-cost change order.”
Surprisingly, what we recommended was to bring down the compaction levels to 90% of Maximum Dry Density Based on ASTM D-698 instead of the more stringent ASTM D-1557 (Modified Proctor) (The latter having the effect of increasing the energy input or compactive effort by 4.58 times!) and to compact the soil Wet of Optimum.
Clearly this was an “Inferior” substitute that was accepted without a reduction in the contract amount.
Why was the change possible?
1.3 Lahar Project
We were again involved to do preliminary consulting work involving Lahar as a Construction Material for a significant Lahar Protection Structure.
The initial specifications called for Proctor Densities and Specified the Optimum Moisture Content required.
Since the structure would be constructed during the dry season, water was a big problem that could hamper the construction of the structure in time for the next onslaught of Lahar.
We have done preliminary work on Lahar on our own as a matter of professional interest and we knew that Lahar behaved as a clean granular soil.
Therefore, we recommended that the Lahar ought to be even compacted in a very very dry state. After a lengthy explanation and initial disbelief, everybody agreed to do so and thus eliminated an unnecessary requirement which could have even hindered the construction progress or even resulted in the specifications not being attainable in the field.
Again, a timely intervention applying sound Soil Mechanics principles saved the day for the project.
1.4 Stalled Vehicle Wheel
A hypothetical but common case which involves a car wheel stuck in a hole on loose beach sand.
As we know, accelerating only digs the wheel deeper into the ground in both cases.
Saturating the sand with sea water somehow makes the sand firm enough to hold the weight of the wheel and soon enough the vehicle is freed.
This is a commonplace solution that is done almost without the thought that Soil Mechanics principles are involved.
The solution to the foregoing case studies all have something in common, and that is a clear undestanding of the behavior and physical characteristics of the soil and application of Soil Mechanics to the solution of “simple” Earthwork Problems.
As is often the case, problems such as these have occured in the field countless times without being correctly identified and thus have resulted in significant losses to the contractor, delays in the projects and substandard quality of compacted earthfill.
Again, it must be qualified that it is not only the contractor who is to blame but also the Consulting Engineer in most instances for this state of things. Our only consolation is that the problem is not only unique to our country but also even in more advanced Western Countries.
A vigorous search of various Soil Mechanics and Foundation Engineering Books yielded only fleeting or sporadic references to these common problems we encounter in day to day Earthwork Construction where soil mechanics principles are applied.
It is the intention of this paper to unify and integrate references to these in various literature on this topic to provide a more “concentrated” understanding of Fundamental Soil Mechanics Principles as applied to Earth Compaction and Earthworks in General.
2.0 THE MECHANICS OF SOILS
In order to successfully apply Soil Mechanics to the solution of our Earth Compaction problems, it would be necessary to have a clear understanding of the fundamental principles.
However, for this paper we shall only limit ourselves to a clear understanding of Particulate Mechanics or the behavior of soils as discrete particles when acted upon by various forces such as gravity, vibration or impact, water and seepage or combinations of these forces.
We shall strive to make the problem as simple as possible even to the layman in order for him to have a fundamental grasp. We however would recommend review of various literature on the subject for those who wish to have a deeper understanding of the problem at hand.
3.0 SOIL AS A PARTICULATE MATERIAL
Under a very powerful electron Microscope, even a piece of seemingly solid mass of clay appears as an assemblage of particles with some orientation. This orientation surprisingly can be altered by reworking of the clay, addition of or removal of moisture or by altering the chemical make-up of the porewater.
Under normal conditions it would also be noted that the assemblage includes water and air. The water is either captured or adsorbed water or free water.
The process of compaction is nothing but the expulsion of air (reduction of voids in the soil). Thus, our attention is directed as to how this could be most efficiently done.
However, as we know, this assemblage that we just saw in the Electron Microscope is only but one of two major assemblages that soil can assume depending on its granulometry or Grain Size.
Soil can either be:
Coarse Grained (Sand) or Cohesionless
Fine Grained (clay) or Cohesive
The clear distinction between the two are somewhat obscured by their combinations that could be found in nature. In their unadulterated states, the differences become readily apparent or clearly distinguishable.
4.0 SOIL SHEAR STRENGTH
Particulate materials derive their strength from friction or intergranular contact and/or from bonding forces or cohesion as we know it. These bounding forces and friction prevent the particles from sliding.
The most important soil strength property that we have to deal with is the soils’ Shear Strength since most of the loading that the soil is subjected to causes the individual soil particles to slide or “shear” one against the other because of their particulate character.
Depending on the granulometry of the soil, the shear strength is either derived from electrical and chemical forces of attraction (cohesion) and repulsion as in clays or by simple grain to grain contact and friction as in Pure Granular Materials. Since shear strength depends on the integrity of the sliding resistance of the individual soil particles, it only follows that the more compact the soil becomes, the higher the shear strength and vice versa. The only way to cause this increase in strength is to lessen the interparticle distances by the expulsion of air and/or water by cementing it which is sometimes resorted as in soil cement if good materials are not readily available.
This leads us to one of the Fundamental Principle in Earth Compaction:
“Increasing Density (Strength) is achieved by decreasing the soil interparticle distance through the expulsion of air or water or both.”
As we shall see later on, reduction of interparticle distances would sometimes require addition of more water into the soil in order to dislodge more water. This statement appears to be confussing but its proof reiterates the importance of the understanding soil particulate behavior in the solution of Earthwork Problems.
5.0 MICROSTRUCTURE
5.1 Clay Microstructure
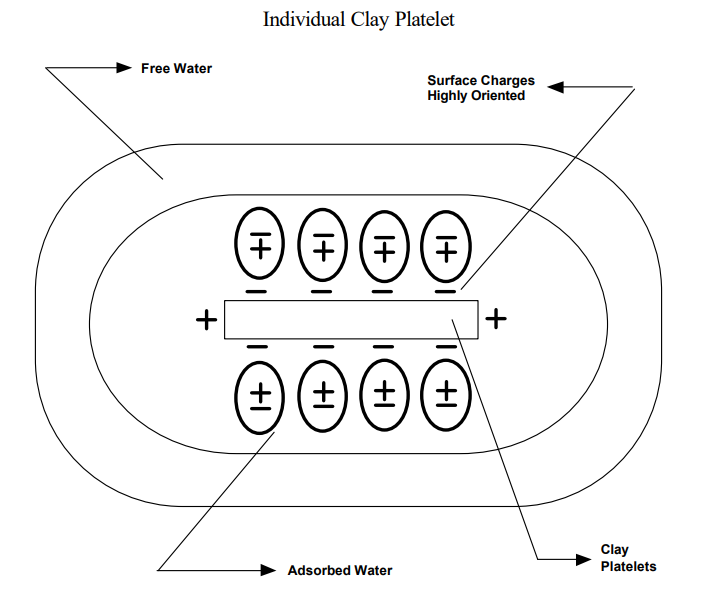
Let us now peer again at our microscope to look at a sample of cohesive or fine grained clay soil.
As we can see, the clay is composed of submicroscopic platelets surrounded by Electrical charges, a closely held layer of adsorbed water and an outer layer of loosely held water. The interparticle distances, measured in Angstroms are governed not only by the particle orientation but also by the Electrical forces of attraction as well as the thickness of the adsorbed and free water. It would take a very high input of energy in order to dislodged or remove the adsorbed layer. However, the loosely held water can be removed in the field by sample air drying or windrowing. Once the free water is removed, compaction can be attained. The particle orientation as we shall see in the succeeding table also affects some other physical performance characteristics of the soil.
5.2 Sand Particles
Obviously we do not need even a conventional microscope to be able to see the granular structure of sandy soils. In fact this can be done with the naked eye.
A very dry sand in the hand can not be squeezed into shape whereas a semi moist sand when squeezed could hold some shape until it dries out and crumbles. Surprisingly, addition of more water to saturate the sand collapses the sand as in the very dry state.
When grains of dry sand are gently deposited in a container, they fall into place in a precarious grain to grain contact. A jarring motion imparted on the container causes the grains of sand to assume a denser packing. Slight addition of water causes the sand to swell or increase in bulk while saturation with just enough water that is somehow allowed to drain causes the sand to be compacted into a dense state. This has been known to us since time immemorial as Hydrocompaction. Perhaps only the mechanism behind it is not well understood.
5.3 Microstructure of Fine Grained Soils
Fine Grained Soils, because of their sub microscopic size are influenced by Electrical and Chemical forces of attraction and repulsion This is due to the fact that the ratio of specific surface area to their volume is so large that surface electrical activity greatly influences the behavior of fine grained soils.
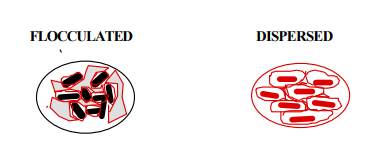
In nature, fine grained soils assume a flocculated or dispersed configuration as shown below depending on the manner of deposition and environmental influences that it has been subjected to.
A flocculated structure assumes a random tip to side orientation much like a “house of cards” whereas a dispersed structure have the platelets more or less aligned to each other.
The arrangement of these platelets alone have an influence on the performance and behavior characteristics of the soil.
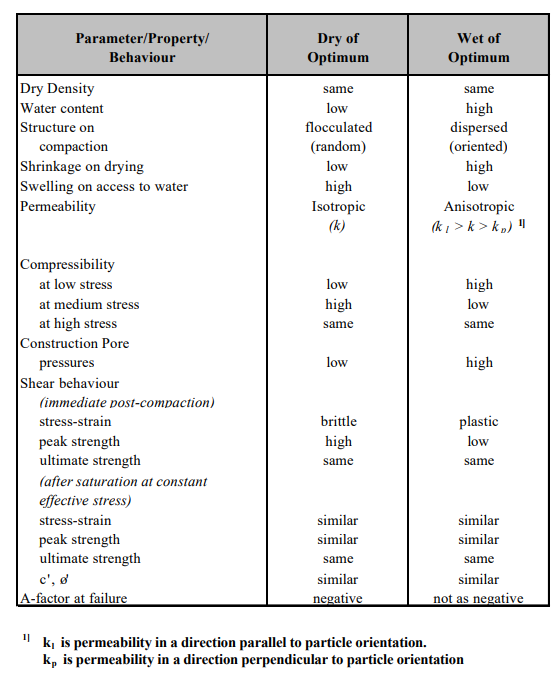
The table above therefore suggests that we can alter the performance and behavior characteristics of the soil to suit our specific needs if only we know how.
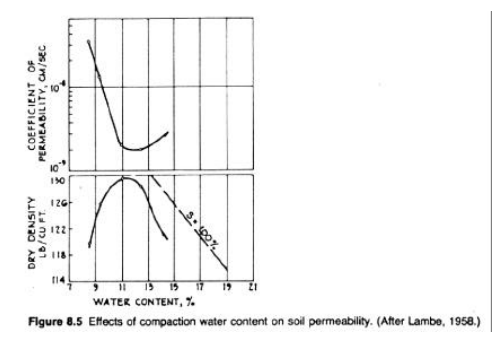
As an example, an experiment with a clay material was made to determine the effects of compaction water on permeability. It can be noticed that although compaction density is the same left and right of optimum, the permeability values are not the same for this specific type of soil.
6.0 MOISTURE DENSITY RELATIONSHIPS
We begin with the all too familiar moisture density relationship known as the “Laboratory Proctor Test” for a clay soil.
Out total familiarity with this simple bell shaped curve and its universal acceptance as the “characteristic” compaction curve has caused most of the problems we encounter today in Earthworks compaction. Too often, it has not been realized that this is not the only shape a laboratory Proctor curve can assume and that grain size and moisture play a great part in influencing the shape of the compaction curve.
This bell shaped curve as, we shall see later on, is only applicable for fine grained soils or soils with significant plasticity as to make it perform as a clay like soil.
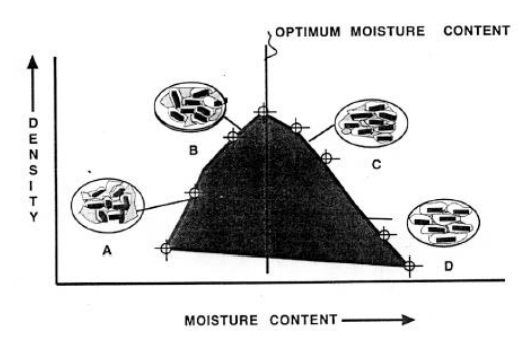
As we can see, at the start of the test when the soil is relatively dry, the soil assumes a flocculated structure “A” additional mechanical reworking and increasing amounts of water and subsequent expulsion of air and closing of the voids tend to produce a semi flocculated structure “B” with increasing density until a peak is attained. This peak is the maximum density that could be attained by that type of soil in the laboratory. This is expressed in terms of “Relative Compaction” which a percentage of the maximum dry density obtained in the laboratory test.
The moisture content corresponding to this maximum density is known as the Optimum Moisture Content “OMC”. Further compaction and aditional water beyond this point results in decrease in density with increasing amounts of water. The soil platelets begin to be oriented and aligned and the interparticle distances tend to widen as more and more water is captured.
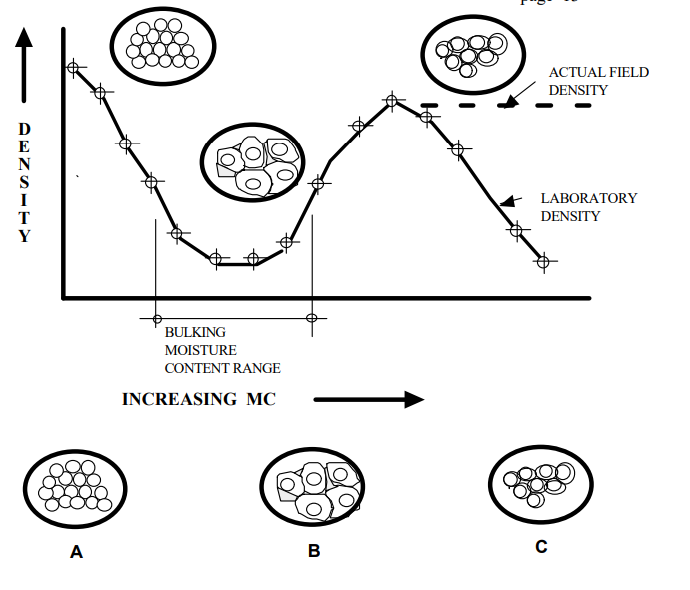
We now look at the Moisture Density relationship curve for a coarse grained sand with very little or no fines.
Since the individual grains are relatively very very large compared to the clay platelets, we know that surface forces play very little influence on the behavior except at a certain moisture content range.
We see right away that the Moisture Density curve indicates two density Peaks “P1” and “P2” where density is high. The first Peak P1 occurs when the soil is very very dry (MC ‘ O) and the other Peak P2 at almost saturation conditions. We also see that between these two Peaks is a valley where density is lowest.
The reduction in density in this valley as defined by a moisture content range is known as the “Bulking Range” for this particular sand.
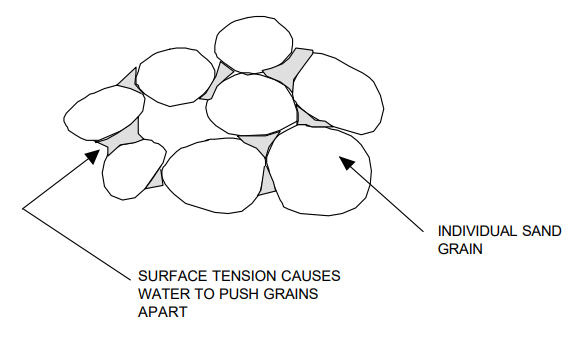
This reduced density is caused by surface tension forces of the water surrounding the individual grains which tend to drive the adjacent grains farther apart, causing loss of interparticle contact and collapse in the density from the previous high.
However, progressive addition of water beyond the bulking range collapses the surface tension and the additional hammer impacts increases the density again to the second Peak “P2”. The laboratory curve shows a downhill movement in density with increasing moisture content beyond saturation levels.
The real field curve shown by the dotted line suggests otherwise. The reason behind this is that in the laboratory compaction procedure, the water can not drain within the steel compaction mold and thus the soil becomes a soupy mush. However, in the field, additional water is continually drained and the Peak density is maintained.
This curve clearly shows the fallacy of specifying Proctor Compaction Procedures and an OMC for clean coarse grained soils, because definitely, the soils are insensitive to moisture content except at the very dry and very saturated conditions. Unlike clay soils which follow a typical bell shaped curve, clean coarse grained soils exhibit a typical “S” shaped curve with the Peaks P1 & P2 clearly distinguishable.
Peaks P1 & P2 may sometimes be equal but this is more of an exception than the rule and their relative maximum values could shift either way depending on the type of soil.
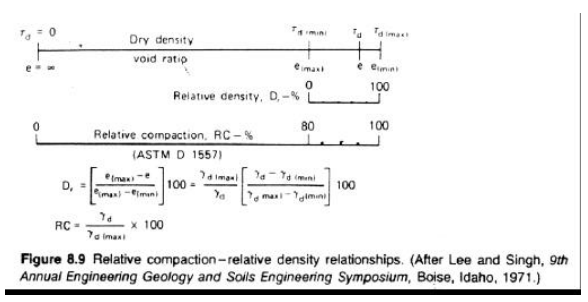
This soil behavior has been recognized by ASTM and standardized into two standards ASTM D-4253 “Max. Index Density of Soils using a Vibratory Table” ASTM D-4254 “Min. Index Density of Soils and Calculation of Relative Density” to arrive at a minimum and maximum density. These values are then used to compute the Relative Density DR once the Field Density is obtained.
Compaction is specified not in terms of % of MDD but rather as Relative Density DRand their relationship to each other is shown in Scalar Fashion.
Recognition of the two characteristic compaction curves (The “Bell” and the “S”) leads us to the realization that clays and sands behave very much differently when compacted and require different approaches and solutions.
We also know now that the behavior of soils can be tempered to suit our requirements as shown in the foregoing table particularly for a clayey soil.
Thus, we are led to the following conclusions:
There is not one but two General characteristic curves for soils depending on their granulometry.
The concept of Optimum Moisture Content generally does not apply to Clean Granular Soils and therefore the Proctor Standard is inappropriate or could lead to problems in the Field. Clean sands either have to be compacted very very dry or very very wet in order to achieve the maximum density.
The microstructure of the soil needs to be considered in the selection of the right compaction equipment.
For Fine Grained Soils, although density is the same for corresponding points left and right of the OMC, the performance and behavior of the soil are different due to the alteration in the microstructure arrangement.
Beyond the maximum density, additional compaction energy would be detrimental to both clays and sands as breakdown can occur causing a decrease in density. Therefore, use no more than what is necessary to attain good compaction.
For intermediate soils, it would be necessary to determine in the laboratory the characteristic behavior from zero MC to saturation levels.
In case the laboratory curve is not clearly defined or when there are doubts as to the behavior in the field, a field compaction trial would be required.
6.0 COMPACTION EQUIPMENT
Having recognized the behavioral characteristics of soils (Particulare Material) we now look at the means to achieve compaction in the Field.
However, try to remember the fundamental response of the two general types of soils to compactive effort:
Loose Clean Granular Soils because of their precarious grain to grain contact are best compacted by causing a jarring motion such as what a vibratory roller would impart.
Fine Grained Soils on the other hand respond better to a kneading type of compactive effort such as that imparted by sheepsfoot rollers and pneumatic type rollers as these tend to reorient the platelets.
We now look at the Chart below to determine the range of applicability of various compaction equipment:
We can therefore see the effective range for various compaction equipment under differing soil conditions and we recognize right away that this has something to do with the grain size (clay to rock).
At first glance, it could be said that this is a very familiar and well accepted practice.
However, it would be shocking to know that in a big project inside a U.S. Base, the Earthworks subcontractor was unable to compact the highly plastic soil despite repeated passes. Several weeks of reworks have passed before we realized that the contractor was using a Vibratory Roller on a clay soil. Over vibration of the clay soils had in fact caused the formation of Shear Cracks causing weakening of the soil! When the compactor was changed, the problems of the contractor vanished.
7.0 APPLICATIONS OF KNOWLEDGE GAINED
However, it is not only enough to know how to select the proper compactor for the job. It is also important to use this in conjunction with our knowledge of Soil Mechanics principles which we now apply:
7.1 Sands and Clean Coarse Grained Soils
Vibratory compaction works best. However, we should aid this by liberal application of water immediately ahead of the vibratory compactor. Remember, coarse grained soils compact best at the very very wet condition “P2” or at very very dry condition “P1”. Water serves as a lubricator but its total absence also prevents capillary forces from impeding the rearrangement of soil grains into a denser packing. Speed of the vibratory compactor is also important and needs to be controlled to about 2 to 4 KPH. Vibratory frequency is also essential and should nearly approach the natural frequency of the soils. Standard frequencies are in the range of 30 to 40 cps.
The static weight of the vibratory roller is also important since the dynamic force exerted on the soil is a function of the static weight. The wheels of the roller are either ballasted by water, sand or even slag in order to increase the static mass.
Because the vibratory roller causes an “advancing wave” on the top of the lift being compacted, Field Density Testing in order to be fair has to be done below this disturbed layer. It will normally be required to scrape the top 50 cms before seating the Field Density Plate in order to be able to test the actual condition of the specific lift.
Field Density testing using the Sand Cone Method (ASTM D-1556) requires extra care since the means to measure the volume is calibrated clean sand. Any jarring motion results in increased sand intake of the test hole resulting in bigger hole volume computed than the actual resulting in low compacted densities. This condition can also be caused by compaction equipment being allowed to operate very near a Field Density test in progress.
In one project, a bull headed contractor’s foreman could not be prevailed upon to stop his operations while tests were being performed nearby. He only relented when a series of “Failing” FDT results made him realize his mistake.
Back to the subject of moisture content, for clean coarse grained sands, moisture is irrelevant except for the total absence of it or its presence at saturation levels.
Thus, there is no such thing as an Optimum Moisture Content and proctor criteria is entirely inapplicable in this context.
7.2 Clays and Intermediate Soils
For Fine Grained Materials and intermediate soil types possessing significant plastic fines, sheepsfoot rollers or pneumatic tired rollers are best. The kneading action allows reorientation of the grain and allows expulsion of entrapped air.
The sheepsfoot was modelled really after the shape of a sheep’s foot perhaps based on the observations of Mr. Mc Adam. The tendency of the sheepsfoot is to walk- up by progressively compacting or densifying the lowermost layers first and walking upwards. Thus we see that topmost layers are slightly less compacted and therefore need to be bypassed when conducting a Field Density Test.
In stark contrast to clean coarsed grained soils, compaction moisture content and the Proctor criteria are fully applicable and the control of moisture during compaction is a crucial factor in the attainment of proper compaction.
Static weight is also important as it increases penetration of the sheepsfoot and increases the force pressing the platelets together.
Speed is not so critical as it is the kneading action and coverage that is important.
Vibratory motion is not necessary and is in fact harmful as it can cause build up in pore pressures in the soil and also cause shear cracking.
7.3 Lahar
Since Lahar is a byword in Central Luzon and since billions will be spent in Lahar Protection Structures, using Lahar as the primary construction material, it may be worthwhile to consider this as a separate material for this paper.
Although Lahar possess some fines, the fines are non plastic and consist of very fine ash particles.
Lahar drains easily and compacts readily as proven by river crossings which become passable as soon as the flood of Lahar subsides.
From this, we can already infer that Lahar behaves like a clean coarse grained material that it is.
Thus, Lahar is most sensitive to vibratory compaction and could compact well at very very dry or very very wet condition. Moisture control is unimportant except to see to it that either we have none of it or plenty of it during vibratory compaction.
We have done several tests on Lahar as a matter of research interest and our conclusions are as follows:
Lahar behaves as a perfectly granular material.
Lahar responds well to compaction even under ordinary vehicular loading and therefore the passage of construction traffic alone could assist compaction.
Lahar possess high initial CBR value but some degradation in the CBR strength occurs if the sample is aged at saturation conditions (this is probably due to breakdown in the ash coating the individual grains).
Significant sulfate levels were present (at least during the initial discharge) which could impair the integrity of Portland cement concrete when this is used as fine aggregate.
We have noted that several tests have been performed by some agencies which show the all too typical bell shaped curve and therefore an Optimum Moisture Content. However, it would be noted right away that compaction started at moisture contents of 3% or greater and thus the Peak “P1” remained undetected leading to erroneous conclusions and the unnecessary imposition of an Optimum Field Moisture Content.
8.0 CONCLUSIONS
The purpose of this paper would have been already truly served if the construction industry would start to recognize the differences in behavior between coarse grained and fine grained materials through the use of sound Soil Mechanics principles rather than from “feel” of guess work.
Often times, these fail in the actual field situation and the simple task of Earth Compaction becomes a costly and heartbreaking exercise.
Cracking and heaving of a Single Storey R.C. Building was initially perceived as settlement. This error led to unnecessary and costly remedial measures such as Piling for the Phase II Building which further aggravated the problem. The heaving was caused by a seemingly innocent decision during the construction stage to use Slag from a steel mill as the base course material. This Slag reacted with the highly corrosive groundwater which caused heaving of the Building and discomfort and morale problems to the Building occupants. Careful engineering study and investigation resulted in a very simple solution which saved the Building from abandonment and demolition.
INTRODUCTION
A Single Storey Precast Reinforced Concrete Research and Development Building was built in Two (2) Phases starting with the Phase I in October 1975. After the construction of Phase I, severe flooding in the area occured in October 1978. Severe cracks were observed in the Precast Post Tensioned Waffle Roof Slab and supporting Beams and Walls. Cracking and extreme waviness was also observed in the Floor Slabs, making office work very difficult. This initial cracking and distress became progressive over the years and “settlement” of the Building was suspected. Extensive structural epoxy adhesive repairs were made on the cracked portions by the original contractor. In addition full scale load tests were performed on the waffle roof slab.
Because of the suspected “settlements”, it was decided by the owner to construct Phase II on Pile Foundations. Soon after construction, cracks were also observed in this Phase II portion but in contrast to the Phase I portion, more severe cracking occurred on the walls and not on the slabs.
In the meantime, cracking continued on the Phase I structural elements despite the structural repairs. This condition was puzzling to the owners and several Engineers were consulted to look at possible remedial measures. Because of the client’s concern for the safety of its employees, abandonment and demolition of the Building were contemplated. It was at this point that our services were engaged to have a critical last look at the Building and to ascertain the cause/s of the problems. We were also asked to determine whether the progressive cracking can be arrested and the building rehabilitated with the safety of occupants being the foremost consideration.
DESCRIPTION OF THE BUILDING
The Research and Development Laboratory building was originally proposed as a two storey reinforced concrete building with precast post tensioned waffle slabs but after some distress was observed early on, the plan was abandoned. The facility was built in a low lying area in the suburban town of Pasig in Metro Manila. The area is sometimes flooded when the Marikina River overtops its Banks during a 10 year flood.
A two meter Engineered Fill was placed to elevate the Building’s Finished Ground Line from the surrounding area. A half meter layer of “heavy aggregate” base course was laid and compacted to support the slab on grade. This engineered fill and base course was laid to support the Parking, Driveway and the entire Building footprint to include the future Phase II addition. The filling and compaction for the whole area to include the proposed future Phase II addition were all done at the same time.
The center was constructed in two phases as follows:
Phase 1
This phase was constructed starting October 1975 on continuous footings supporting column loads through socket pedestals loading on to the continuous footings. Founding elevation is approximately 2.8 meters below finished floor line. The columns are 0.35m x 0.35m precast concrete columns inserted into sockets in the footing. The roof consists of approximately 1.0m x 1.0m precast waffle slabs joined together by cast in place concrete packing and post tensioning. A layer of water proofing was subsequently applied. Perimeter walls consist of 150mm CHB units and plaster finished with protruding fins also of CHB. Interior walls were also of CHB resting on the slabs. The floor is a 100mm thick reinforced concrete slab on “heavy aggregate” Base Course over the imported granular fill material.
Phase II
Phase II construction was started in August 1978 or approximately three (3) years after Phase I construction. The structural configuration is the same except that the new building was now supported on Pile foundations because of the observed distress and perceived “settlements” of the Building. This new addition was constructed by another contractor. The walls were now supported on Grade Beams with Flanges acting as continuous footings. The Grade Beams are in turn supported on Pile caps. The floor slab was still connected to the walls and columns by Dowels. Columns were embedded into the Pile caps.
OBSERVED DISTRESS
Two years after construction of the Phase I Building, Flooding occurred in October 1978. The flood waters rose to about 38 centimeters above the floor line of the Building. Although, minor cracking was observed in the Building even before October 1978, extensive cracks and more regular repairs reached its peak in 1982 and became a major problem and concern for the owner as well as the Building occupants. The corridor slabs became so wavy that normal walking was difficult and passage of pushcarts of chemicals had to be done carefully to avoid spillages. As earlier discussed, there were contrasting failure patterns and observed cracking between Phase I and Phase II construction. For clarity, these are discussed in detail separately as follows:
Phase 1 Distress
Phase I was constructed in October of 1975 on continuous footings resting on well compacted Engineered Fill. Severe cracking and extreme waviness were observed in the slabs. Maximum slab displacement is 130mm (5.21 inches) at the analytical laboratory. The 3D mesh plot of the slab deformations is shown in Fig. 1. The 2D Contour Plot is also presented in Fig. 2. Cracks have been observed in the masonry walls but were not as severe as in the Phase II Walls. A noticeable separation gap was observed between the roof and the wall with the exterior walls opening outwards. The extreme waviness of the slabs has made normal office work difficult. Desks and cabinets needed to be periodically relevelled on stilts (See Fig. 3) to prevent rolling of pens and pencils from the desk top. Fulltime carpenters had to regularly realign doors and windows to allow proper closing and opening. Light Partition Walls separated from Floor Slabs (See Fig. 4) However, the most serious effect was on the morale of the workers as they were constantly in fear that the Building is going to sink or collapse on them.
Phase 2 Distress
Soon after completion, the walls of the Phase II addition experienced more severe cracking than the corresponding walls of the Phase II portion. Waviness was detected in the slabs but somehow these were lesser in magnitude as can be seen in Figs. 1 and 2. The main indication that something was still wrong was in the extent and magnitude of cracking in the walls and constant adjustments on the doors and windows (See Fig. 3). Cracks were mainly opening upwards but in addition, some cracks tended to indicate that the walls were trying to separate from the columns (See Fig. 4). Leaks in the Precast Waffle Slab occurred, indicating movement of the roof slab. The floor slabs had perceptible bulges at the center of the panels but were not as pronounced as in the
Phase I Construction. Some Engineers consulted have even ventured as far as to say that the Piles have somehow “reduced the settlements” but no explanation could be given for the more severe cracking of the walls. These two highly contrasting distress manifestations baffled the client and the occupants of the Building. However, the general conclusion still was that the building was “settling” and that all remedies have been exhausted. Abandonment and demolition of the Building was therefore being contemplated.
INVESTIGATION
In early 1984, we were contracted by the client’s Corporate Engineering Department to undertake an investigation to unravel the seemingly conflicting failure patterns in the two buildings. Explanations were needed as to why despite substantial expenditures in Piled Foundations, the Phase II portion of the Building was still “settling” and cracking with more severe cracks in the walls than were observed in Phase I.
The investigation programme consisted of the following phases:
Soil Borings along the periphery of Phase II in order to determine underlying soil properties in the area of the piled foundation.
Test pits inside and outside of the building to retrieve soil samples and determine character of fill material in the area.
Laboratory soil classification and strength tests of soil and physical characteristics.
Laboratory chemical testing on soil leachate samples and water samples in the building.
Interviews with R&D Laboratory personnel and document review of various tests conducted for the R&D Laboratory Building relevant to the investigation.
Measurements of Ground Heave inside and outside of the building and the preparation of the subsequent Heave Contour.
Recording of observed cracks and structural features including photographs and their subsequent mapping to aid in the structural rehabilitation and repair of the building.
Analyses of possible loadings imposed on the soil by the foundation elements of the building and corresponding settlement analyses.
Understanding of construction plans furnished by the client insofar as it would assist in interpreting the responses of the various building elements to the heave forces.
The findings obtained in the foregoing investigation together with the results of various tests served as bases for the correlation and understanding of the mechanisms contributing to the observed problems in the building and outside of the building. No effort was spared to investigate possible causes of the cracks in the attempt to conclusively isolate the forces that are triggering the observed distress in the building. Immediately after our commissioning, we made exhaustive investigation and conducted interviews with Building occupants to reconstruct and piece together the chain of events. Almost all the Building occupants from the scientists to the Building Manager were of the opinion that the building was “sinking ” and that nothing further could be done to save the Building. Morale was so low that some employees interviewed thought that the investigation was another delaying tactic by the management to postpone abandonment of the Building because of the vital research studies being made at the time. All of these were proved to be untrue after a very challenging investigative work which in the end tied together all the loose ends and helped us arrive at a simple solution which saved the building. Early at the start of field work and testing, it was already clear to us that the crack patterns manifested were caused by heaving and not by settlements.
What was not clear to us at the onset were:
What was causing the heaving ?
What was the explanation for the differing crack patterns in the two phases of the building ?
Potentially expansive soils were not prevalent in the general area nor was the imported fill expansive, since it was essentially silty fine sand and therefore the agent causing the heaving had to be identified and isolated.
SOIL INVESTIGATION
The initial investigation program consisted of three boreholes around the Phase II Building to a depth of 20.0m average and several test pits outside the Building footprint. The borings were done to determine underlying soil strength parameters and also to detect the presence of potentially swelling soils. Since initially we suspected that the expansive soil was not the Engineered Fill, concentration of the soil borings was focused on natural ground about two meters below. Nevertheless, regular sampling and field classification was done starting with the base course, the Engineered Fill and the natural ground. The “Base Course” material was initially and innocently classified by the Field Engineer as “gravel base course”. It was only when we dug the test pits that we learned that this was no ordinary “gravel base” course as initially identified, since these were extremely heavy and there were large chunks that were like huge flakes in the test pit. Picks cannot even indent the material and finally, Saw cutting with a carbide blade showed that it was iron. What was also surprising to us initially was the presence of dark gray fluffy cotton like materials in the heaved portions.
SLAG USED AS BASE COURSE
Further investigation revealed to us that a well meaning and cost cutting decision was made during construction to use SLAG wastes from a steel mill as the base course material since it was free for the taking and it compacted readily. This “base course” was laid to a thickness of 0.30m to 0.50m in some places and was spread in all the proposed built-up areas including the future addition and the driveway. The gray fluffy cotton like material turned out to be SLAG that has fully expanded after corrosion (See Fig. 8 & Fig. 9). The expansion potential can be gaged from the size of the cavity and magnitude of heaving that it has caused. More numerous test pits were therefore recommended to be undertaken inside the Building footprint to verify the extent of the slag. All the additional test pits showed the uniform presence of the slag base course and the degree of expansion and corrosion that has occured underneath (See Fig. 7 & Fig. 8). Most of the test pits were excavated under the heaved areas and also some in the unaffected areas. In both cases, slag was present in varying conditions of expansion and corrosion. Levelling to determine the slab contours was also done inside the Building with the vertical Benchmark made outside the affected areas. The levelling was done using liquid level hoses because of the numerous partitions rendering optical levelling next to impossible. The results are depicted in Fig. 1 and Fig. 2.
RESULTS OF CHEMICAL TESTS ON SOILS AND WATER-R&D CENTER BUILDING
In some of our interviews, complaints were heard regarding the water from the deep well that was causing stomach problems and sometimes Diarrhea. Subsequently, we made recommendations to test the water from the deepwell and also in some of the adjacent Buildings and Factories being served by similar deep wells. The results are shown in Tabular Form in Fig. 10. The results show that most of the water from the deepwells in the area have corrosive potential as indicated by their Langelier Saturation
Index (LSI) values. Chemicals tests were performed on several soil sample Leachates and water from the Deepwell of the R&D Building. The objective of the tests is to determine corrosion potential after test pits showed the presence of slag (iron) in the general area investigated. The Langelier Saturation Index (LSI) was obtained by computation from the test parameters. The soil leachates were obtained by mixing one part of soil to one part of distilled water. The mixtures were shaken for two hours at 200 oscillations per minute and allowed to set for 24 hours.
The resulting extracts were analyzed for:
pH
Conductivity
Alkalinity
Total Hardness
Sulfates (SO4)
Chloride
Acidity
Fig. 9 tabulates the values of the various chemical tests conducted on water samples in Soil Leachates at the R&D Laboratory.
Several conclusions can be inferred therefrom as follows:
Water from R&D Laboratory and surrounding areas have corrosive tendencies. Of the thirteen (13) samples whose corrosion potential were measured using the LSI, seven (7) samples exhibited corrosive tendencies.
Chloride content for R&D well water is excessively high (about 800 to 900 ppm).
Sulfate (SO4) content of the slag is very high (975 ppm).
pH values indicate slightly basic to slightly acidic values for most of the water samples tested.
POSSIBLE MECHANICS OF CORROSION
Several possibilities could trigger the corrosion of the slag and its consequent expansion during the corrosion process. The resulting expansion has been found to increase the volume of the steel or iron by as much as 10 times its original volume, in the process generating large expansive pressures when confined.
Slag
The use of slag as a fill material proved to be detrimental as the material could corrode even in ordinary tap water given the proper environment. The slag obtained from most electric arc furnaces is slightly basic in character but contains large amounts of sulfates, manganese and other impurities from the steel making process. This is borne out by the very high sulfate content obtained in sample 5-14 of Fig. 10 from Test Pit No. 1. Because of the nature of the slag formation in the mill, vesicles were formed containing entrapped air. The large particle size (gravel to cobble size) of the slag also allowed air entrapment during the compaction process. The entrapped air promotedor accelerated corrosion because of the presence of oxygen.
Groundwater
As earlier stated, the groundwater is generally corrosive (Langelier Saturation Index Negative). In addition, chloride content is high which can trigger pitting and corrosion in the slag. The foregoing primary factors alone would already indicate the highly favorable environment to initiate and sustain corrosion. Since the total corrosion decomposition of steel or iron would be a long time dependent process, its simulation in the laboratory would for the purposes of this investigation be too long. However, samples extracted from the test pits showed varying degrees of decomposition and oxidation stages when tested in the laboratory using a NaCl solution. In order to fully understand the mechanism, the following definitions are extracted from ASTM 6-15-79a “Standard Definitions of Terms Relating to Corrosion Testing”.
Corrosion – the chemical or electrochemical reaction between a material, usually metal and its environment that produces a deterioration of the material and its properties.
Graphitic Corrosion – the deterioration of metallic constituents in gray cast iron which leaves the graphitic particles intact.
The corrosion of ferrous metals is caused by the tendency of iron (Anode) to go into solution in water as ferrous Hydroxide and displaced Hydrogen, which in turn combines with dissolved oxygen to form more water. At the same time, the dissolved ferrous hydroxide is converted by more oxygen to the insoluble ferric oxide thereby allowing more iron to go into solution.
Corrosion therefore requires liquid water (as in damp air) and oxygen (which is normally dissolved in water).
Corrosion occurs only in the presence of an ionizing medium. The most universal ionizing medium is water. No corrosion will occur in the total absence of water. The rate of corrosion is affected by the amount of dissolved oxygen present.
The dissolved oxygen could react in either of two ways:
By combining with the hydrogen film to expose the surface of the metal (which the film protects).
By combining with the dissolved ferrous hydroxide to form insoluble hydrated ferric compound and thereby allow formation of more ferrous Hydroxide.
The chloride ion solution tends to dissolve the protective coating already formed and tend to prevent new coatings being laid down thus further accelerating corrosion.
Having understood the probable corrosion mechanisms, the following can be theorized:
The corrosive groundwater as it was elevated by flooding or during the rainy season immersed the metallic slag in solution causing decomposition. Sufficient dissolved oxygen is existent in the soil and trapped in the large voids present in the slag.
The R.C. slab acted as an impermeable membrane which ensured entrapment of moisture keeping the slag in at the very least a moist environment. This ensured progressive corrosion. Because of the confinement of the surrounding soil on the slab, the slag exerted an upward pressure which offered the least resistance causing the slab to heave.
In addition to the foregoing and as can be shown in the subsequent sections, possible leakages in the pipes, more specifically in the acid and waste chemical lines could have aggravated the corrosion.
Inspection of the photographs and test pit logs (See figs. 11 & 12) clearly show that the slag layers have expanded upward and heaved the concrete pavement.
OBSERVATIONS ON THE RELATIVE MAGNITUDE OF CRACKS
With reference to the slab displacement contour map (Fig. 1 and Fig. 2), it can be shown that Phase I has heaved or displaced more than the Phase II. Although the two are supported by different foundation elements (continuous footing vs. pile foundation for Phase I and Phase II respectively), this would not really explain why there is less heaving and cracks in Phase II because if heaving of the same magnitude have occured, more damage would have resulted because of the rigid restraint offered by the piles. It is only possible then that because the slag fill have been laid out all at the same time, that substantial unconfined or unrestrained heave has already occured over time in the Phase II area before construction could take place. Unlike in Phase I, where the slab offered confinement and trapped moisture as to cause progressive heave under restraint. In addition, although it could be observed that there are relatively fewer cracks in Phase II, it can also be shown that in contrast to Phase I, the walls in Phase II are more damaged compared to the floor slab where displacements are minimal. The foregoing is explained by the fact that while substantial heaving has already transpired, the residual heave after construction, though not as large as Phase II displacements, have cracked the walls because of the relatively more rigid restraint or pullout capacity of the piles. Thus the walls were affected more than the floor.
Fig. 4 which was taken along the corridor near the interface between Phase I and Phase II showed a unique but typical crack pattern in Phase II that is not manifested in Phase I.
The crack pattern shows propagation from the floor intersecting the column line diagonally on both sides. This shows that the wall is flexing but because of the rigid restraint of the walls, has failed the wall in shear instead, because of the upward pressure on the wall footings.
Several conclusions can be made on these observations:
There is less displacement for Phase II simply because the slag has already partly expanded before Phase II was constructed.
It is not true that the pile foundation had in some way contributed to reduction of cracks. On the contrary, if the Phase II portion would have been subjected to the full heave potential of the slag as in Phase I, more damage would have occured because of the more rigid restraint.
EFFECT OF WATER AND CHEMICAL LINES
Closer inspection of the displacement contour map would show that the following areas were the most affected by the heaving in descending order.
Experimental Section
R&D Office
CENLAB Office
Technical Library
These areas have one thing in common, and this is the presence of water lines and chemical lines near the heaved areas. It is suspected that the lines have leaked or burst due to corrosion from the groundwater or galvanic corrosion with the slag (dissimilar metals in contact) or have been broken by initial heaving thus contributing to acceleration of the corrosion process. Even without the foregoing, leakage of chemicals has been detected in the PVC connections of the chemical sinks in the Experimental Section. This condition probably contributed more corrosive chemicals under the slab as to cause the extensive Heaving in the Experimental Section.
RECOMMENDATIONS MADE FOR REMEDIAL ACTION
After satisfactorily proving to the owner that the Building was actually rising due to heave and not “sinking” as originally perceived, we set out to make recommendations on remedial measures that need to be undertaken. Since the Building was not on the verge of collapse nor seriously damaged by the heaving, we submitted a three staged rehabilitation program. This was necessary as critical research work is ongoing at the time and total or major disruption could not be allowed for the time being. The following were the remedial stages as recommended:
Stage I : Release of Floor Slab from wall
The floor slabs which were originally dowelled into the perimeter walls and interior walls were recommended to be saw cut using a diamond saw. This has the effect of releasing the walls from any uplift pressures acting on the slab. This will in turn reduce the cracking on the walls and other structural elements.
Stage II : Removal of Slag Base Courses
As soon as facility work load permits, the slabs that were released by diamond saw cutting shall be removed and the slab excavated and replaced by compacted clean granular Fill. All water utilities (Drainage & Sewage) as well as chemical lines shall be inspected for damage or corrosion and if need be, replaced by PVC Pipes or Compatible Plastic Pipes in the case of the chemical lines. The columns should be inspected to determine if any pullout from the socket footings has occurred so that this could be repaired. The granular Engineered Fill Subgrade shall be tested in case any residual acidity is present and this shall then be neutralized with lime milk before the granular base course is placed and compacted.
Stage III : Monitoring and Crack Repair
We recommended installation of a permanent reference Benchmark to monitor further movements in the Building after Stage I and Stage II repairs have been implemented. In case movements have ceased, epoxy repairs of all cracks should be undertaken after thorough cleaning of all cracks.
CONCLUSION
The owner has implemented Stage I and Stage II for the Phase I structure and Stage I for the Phase II structure. In the case of the latter, the freeing of the Slabs was already sufficient to arrest further cracking of the walls. Since swelling was preinduced before Phase II Construction, the resulting heave after construction was very much less than the heaving experience in Phase I Construction.
Stage III was subsequently carried out and to this time no further distress or cracking has been reported in any of the Building Elements. The paper illustrates how a seemingly innocent decision to use “good aggregate” in the form of slag as a base course nearly caused the abandonment and demolition of a building. It also illustrates how the initial but erroneous perception of movement of the structure as being downward or “settling” has caused additional but unecessary expenditures in the form of Piled foundations for Phase II Construction. The use of Piled foundations aside from adding to the cost and giving false hopes, only aggravated the problem by increasing restraints on the walls causing more serious cracking in the latter. The investigative procedures employed led to the isolation of the slag as the agent causing the heaving of the Building and the cracking of various structural elements. The resulting simple remedial measures employed, which consisted of removal of the slag and freeing of the slab connections from to the walls, saved the Building from abandonment and demolition.