By Emilio M. Morales, MSCE 1 and Joselito Emmanuel J. Cruz, CE 2
ABSTRACT: Oftentimes, the Consulting Engineer is confronted with Materials Test Results from which he has to make judgments that would have a potentially large impact on the Project’s cost, schedule, quality or safety. The decisions made depend to a large extent on the Engineer’s knowledge and familiarity with the test procedures, test limitations, significance of the test parameters as it affects his design, the acceptance criteria and material behavior under load or in differing environments. In the strength testing of rebars for example, higher yield stresses during test do not necessarily mean better as other test information/parameters need to be evaluated or before acceptance or conclusions could be made. In the testing of concrete, several failures in a batch of cylinders do not necessarily mean that the batch should be condemned as the statistics need to be evaluated before such a drastic action is even contemplated. In the compaction of soils, excessive compaction leads to breakdown and degradation of the Soil Fabric contrary to ordinary laymen’s expectations “That the more you pound, the harder the ground.” The Engineer should therefore be equipped with adequate knowledge and understanding of the test procedures material properties and material behavior in order to make intelligent and “Informed” judgment calls Engineering Judgment in its truest sense. This paper hopes to open the way to a greater understanding of this important aspect of our day to day practice of the profession in the real world.
1.0 INTRODUCTION
In the Building Industry, “Stronger” has always been synonymous to “Better”. This has been manifested in, and reinforced by, common beliefs due to the survival of archeological structures which because they were Built “Strong”, have actually survived. However, most of these ancient structures have survived through sheer massiveness and more than liberal use of materials such as masonry blocks and mortar. Nevertheless, not even all of these have survived the ravages of Earthquakes in our country. Even those which have survived show scars or damage due to Earthquakes.
It is disheartening to note that this mistaken belief has creeped into our present day practice and most of the time Stronger, Harder, Bigger, Stiffer, etc., have always been Better !
Alas, present day knowledge of material behavior and performance as borne out by Laboratory Tests simulating actual service loading under Earthquake or other conditions have shown that Stronger is not always Better !
This paper hopes to highlight some fallacies in the Design of structures, be it Buildings, Roads or Dams which tended to overdesign or increased strengths by choice or by accident.
In some instances, as we shall find out later on in this paper, higher strengths could lead to bigger problems and may surprisingly at times trigger an earlier failure in our structure than if the structure were purposely made “Weaker”.
Of significance in this discussion is the appreciation of the Test Parameters and results of Laboratory Tests on Civil
Engineering Materials. A clearer understanding of the test results allows the Designer and Consulting Engineer to render proper judgment calls and Engineered Decisions that are supported by the material’s characteristic behavior and the limits imposed by Code or by Standards of Practice and its behavior under loads.
We shall discuss these very important considerations and the role that testing plays for:
Reinforcing Bars
Concrete
Structural Steel
Soils
Sometimes, Design Engineers accept materials substitution without understanding its characteristic behavior. This could lead to objectionable or dangerous consequences.
This is what we are going to find out in order to support the statement “Stronger is not necessarily better”.
First, let us try to understand what happens to Reinforced Concrete under severe Seismic Loading conditions.
In order to do so, we have to go to our Basic Fundamentals of Concrete Design which we summarize:
In Reinforced Concrete design, we were taught that it is desirable to attain a reinforcement ratio that is below Pb or balanced reinforcement (0.75 Pb). This is to ensure that yielding or failure is initiated first on the steel ahead of the concrete compression block to avoid an explosive, Brittle and sudden failure.
Under seismic loading, ductility plays a very important role for both concrete and steel structures. Ductility is critically important in RC Structures under Zone 4 for several reasons:
We would like to prevent sudden failures or collapse without warning.
Initial yielding or plastic hinging has to be initiated at an early stage under severe seismic loads to allow dissipation of energy. Failure to do so build ups larger inertia forces that need to be absorbed by the structure thus causing more severe damage or sudden collapse.
Design under severe Earthquake loadings requires that total collapse does not ensue although the serviceability may be impaired to a point beyond practical repair.
This brings us to focus on just what is necessarily needed to satisfy the foregoing fundamental requirements.
Very critical to this is that yielding is initiated at an early stage where it was assumed by the Designer in compliance with the code for Seismic Design. This can only happen if the Yield Stress is low – (Not Stronger!) but still satisfying the design Yield Stress (YS) specified in the Code and used by the Designer.
Why is this important ?
Postponing the yield as we have said increases inertia forces which the structure has to absorb.
But more important, if yield does not occur at the design yield, Bond and Shear stresses reach critical levels earlier, thus initiating a sudden failure in the structure by Brittle Behavior.
If in addition to this, the Yield Stress approaches the Ultimate Tensile Stress very closely (reduced yield region). Gradual formation of Plastic Hinges is aborted and ultimate strength is reached causing sudden collapse.
A measure of how far apart is the Yield Stress and the Tensile Stress – the TS/YS ratio, is a measure of the ability of the structure to undergo inelastic rotation and absorb energy and dissipate it by deformation or yielding. As the structure loses its stiffness in response to a strong ground motion, its capability to dissipate energy increases. These tend to reduce the response acceleration or lateral inertia forces that develop during deformation of the structure.
The ACI Code & PNS 49 both call for a TS/YS ratio of 1.25.
This sets the minimum distance between the yield and tensile stresses for obvious reasons – To allow sufficient time to develop plastic rotation and promote energy dissipation before collapse is induced.
Implicit in all these is there is a need to impose a ceiling on the yield stress to the level assumed in the design. Thus, it is a fallacy and highly erroneous to accept higher yield strength rebars because they are stronger, in total disregard of the design assumptions !
“Because Stronger is not necessarily better!”
As a specific example, sometimes we encounter situations where the Engineer blindly accepts substitution of Higher Grade Rebars (As when he specifies grade 40 and then accepts substitution by grade 60 without any qualifications) than what he or she used in the design in total ignorance of the need to limit the yield stress.
To compound this, unscrupulous suppliers try to pass on Non Standard rebars or Non Approved Rebars that have significantly very high yield stresses very much closer to the Tensile Stress (A reduced yield region), a TS/YS ratio approaching unity. Therefore inelastic rotation is relatively short and failure ultimately ensues.
Therefore, we can conclude that “Stronger is not necessarily better”.
In another vein, very high tensile (and yield stress) lead to Brittle Failure mode as the materials really are brittle. But this is another story.
In addition to controlling rebar strengths, the reinforcement ratio Pb should also be controlled both ways.
In seismic design, the two extremes are critical. It is necessary that the reinforcement ratio be controlled:
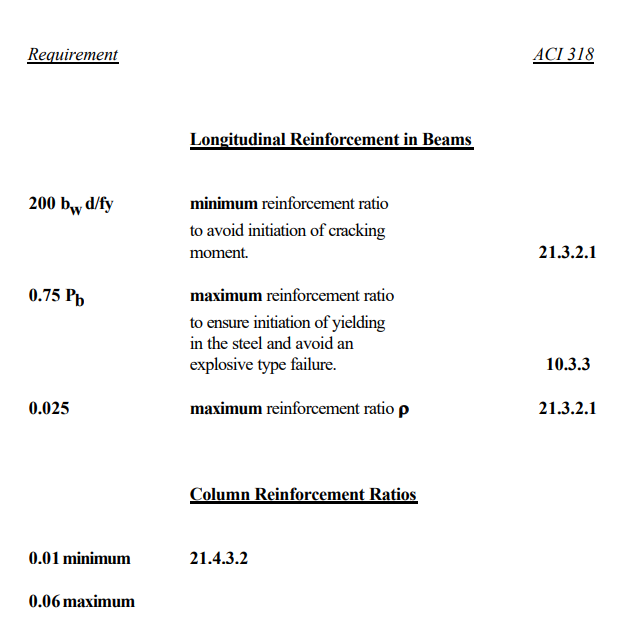
By setting minimum limits to the reinforcement ratio 200 bwd/fy
By setting maximum limits = 0.75 Pb.
There are compelling reasons for the above requirements.
It would not be advisable to severely under reinforce the RC Structural element because the cracking moment Mc would be reached first rather than the yield moment.
In the first instance, a single crack development would cause a sudden catastrophic collapse because gradual yielding and straining is not possible.
In the other extreme, over reinforcement beyond the balanced reinforcement requirement “Pb” initiates early overstress in the concrete compression block rather than allowing gradual yielding accompanied in the rebar by gradual deflections which provides ample warning to the occupants unlike a compression type failure which is essentially explosive and sudden.
Therefore, “Stronger is not better”
Lest we are lulled into generalizations, we also add another admonition:
“Less (weaker) is also not better”
ACI 318 thus imposes the following restrictions for seismic design in .R.C as follows:
2.0 REBARS
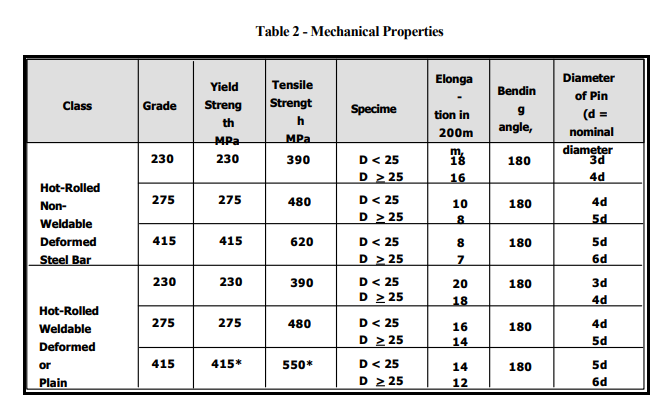
Tests on rebars is guided by Philippine National Standards (PNS) PNS-49:1991 “Steel Bars for Concrete Reinforcement -Specification” by the Bureau of Product Standards covering the following grades of steel rebars:
Grade 230 For both Weldable, 275 and non weldable, 415 hot rolled steel rebars
Looking at the table, it is interesting to note that the requirement for TS/YS ratio (As indicated by **) only applies to Grade 415 Weldable Steel whereas ACI 318 and its commentary is very explicit that the TS/YS ratio should be 1.25 without exception or qualification as to rebar type for Seismic Design.
Thus, there is a real need to amend PNS 49-1991, to amend the Table so as to cover all Rebar Grades and Types (Weldable and Non Weldable to ensure adequate performance in a High Seismic risk location) and thus comply with the ACI Code and the NSCP.
* Yield strength maximum of weldable deformed or plain steel bar = 540 MPa ‡ ** Tensile strength shall not be less than 1.25 times the actual yield strength.
+Plain steel bars are only available in grade 230. Other grades are subject to buyer’s and manufacturer’s agreement.
This clearly has to be amended, because no less than the ACI Code & the NSCP call for a TS/YS ratio of 1.25 without any exclusion for rebars used in regions with high seismic risk.
This brings us to the significance of the TS/YS ratio.
ACI 318 explicitly calls for a TS/YS ratio of 1.25 without exception, for highly seismic Zone S (Zone 4). It also stipulates several important requirements as follows:
The specified yield strength YS should not be exceeded by more than 18,000 psi (124 MPa).
The TS/YS ratio shall not exceed 1.25
PNS 49 is also explicit in that it specifies a minimum and maximum permissible stress for yield stress. What the two foregoing requirements clearly state is that a limit has been set on the yield stress (YS).
Why is this so? This is clearly explained in ACI 318 Subsection 21.2.5 which we quote as follows:
21.2.5 – Reinforcement for Members resisting Earthquakes
“Reinforcement resisting earthquake induced Flexural Stresses and axial forces in frame members and in wall boundary elements shall comply with ASTM A-706, ASTM A-615, Grade 40 & Grade 60 reinforcement shall be permitted in these members if:
a) The actual yield strength based on mill tests does not exceed the specified yield strength by more than 18,000 psi (124.1 MPa).
b) The ratio of the actual ultimate tensile strength to the actual tensile yield strength is not less than 1.25.
Code Commentary R 21.2.5
“Use of longitudinal reinforcement with strength substantially higher than assumed will lead to higher shear and bond stresses at the time of development of yield moments. These conditions may lead to brittle failures in shear or bond and should be avoided even if such failures may occur at higher loads than those anticipated in design. Therefore, a ceiling is placed on the actual yield strength of Steel.
The requirement for an Ultimate Tensile Strength larger than the yield strength of the reinforcement is based on the assumption that the capability of a structural member to develop inelastic rotation capacity is a function of the length of the yield region along the axis of the member. In interpreting experimental results, length of yield region has been related to the relative magnitudes of ultimate and yield moments. According to that interpretation, the larger the ratio of ultimate to yield moment, the longer the yield region.”
Members with reinforcement not satisfying that condition can also develop inelastic rotation, but their behavior is sufficiently different to exclude them from direct consideration on the basis of rules derived from experience with members reinforced with strain hardening steel.”
3.0 CONCRETE
Oftentimes, the Structural Designer specifies the Design Strength (f’c) for his RC Design and leaves it at that. However, when reports of cylinder tests come in and there are reported failures, he responds immediately by ordering concrete cores to be extracted or worse, a load test. Both responses are costly and often not necessary!
All that is probably initially required is a complete understanding of the possible variabilities that can occur in concrete and also how as designer/specifier, he can control these variabilities to desirable limits and thus have a firm basis for acceptance/rejection.
What often happens is that the Designer treats concrete test specifications as fixed and any failure as absolute failures.
Concrete, as we have said, is a highly variable material and as such is subject to the laws of statistics. When the Designer specifies a Design Strength (f’c), he in effect should be requiring something higher than this value in order to ensure that failures are within acceptable limits. Implicit in this statement is the need to specify a Required Average Strength f’cr that is greater than f’c.
When the Engineer unrealistically refuses to accept the variability in concrete strengths and consistently demands that no tests fall below the Specified Design Strength (f’c), he unreasonably inreases the cost of the project, as the supplier has to increase his required strength design to ensure that his breaks do not fall below f’c. Thus, in effect, but perhaps without knowing it, the Designer imposes higher strength concrete which he does not need and forces the supplier to provide overly conservative Mix Designs.
Since stronger concrete is definitely more expensive than an Engineered concrete specification, the theme “Stronger is not necessarily Better again applies.
When the Designer/Specifier expects that concrete compression test results to be always equal to or greater than the Specified Concrete Strength (fc’) he unwittingly causes problems other than increasing the cost of concrete.
Higher strengths are obtained by limiting the Water Cement (WCR) Ratio (which causes a retrograde effect on the workability of the product) or by higher cement content.
However, the foregoing could cause some other problems:
Use of water reducing admixtures or plasticizers to increase workability means added cost per cubic meter.
Increases in cement content brings attendant problems of higher heat of hydration generated which could cause thermal cracking or high shrinkage cracking.
Thus, it would be necessary to gain a fundamental understanding of the variability of concrete and to accept the possibility that failures can and do occur even in a well supervised concrete batching, sampling and test operation or system. What is more important is to know how to control these variables, so that they can be placed within limits of acceptability in consideration of the criticality or demands of the structure. Evidently, not all structures require or should impose very strict demands on strength since in some structures, durability considerations are more important.
In a parallel vein, a nuclear containment structure would definitely have more critical demands on quality and strength as say an irrigation canal.
Thus, the use and application of statistical procedures as recommended by ACI 214 “Recommended Practice for Evaluation of Strength Test Results of Concrete” is critically important.
ACI 214.3R Approximately describes the need to apply Statistical Procedures in specifying strengths for concrete:
“Specifying the Strength of Concrete
When the Structural Engineer specified a “Design Strength” for his structure he in effect specifies a Specified Strength (f ’c).
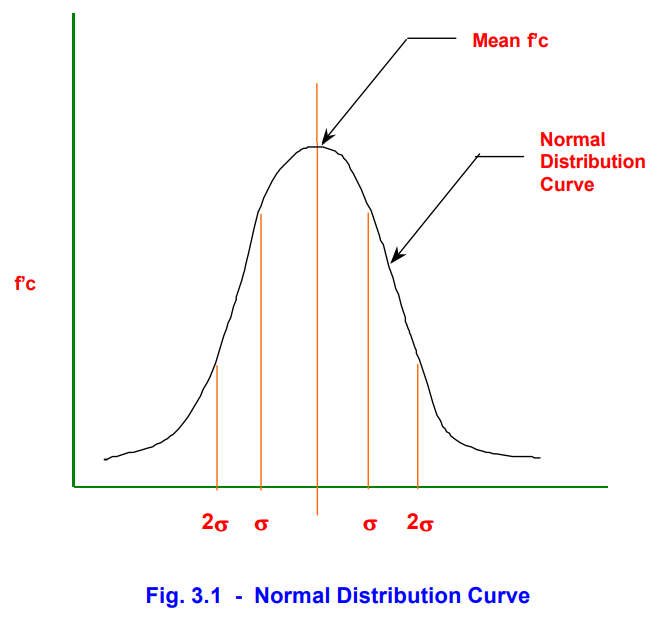
Since the strength of concrete follows the Normal distribution curve, if the average strength of the concrete is approximately equal to the specified strength, one half of the concrete will have a strength less than the specified strength. Because it is usually not acceptable to have one half of the strength tests lower than specified stength, the average strength must be higher than the specified strength by some factor.
The specification writer, in consultation with the Engineer, writes a specified strength and the percentage of low tests that are considered acceptable for that class of concrete. ACI 318, “Building Code Requirements for Concrete” provides guidelines for selecting acceptable number of low tests.”
An example of a statement for strength in the specification might read:
“The average of all Strength Tests shall be such that not more than one (1) test in Ten (10) shall fall below the Specified Strength fc’ of 3,500 psi”
In turn, the concrete producer, in order to meet the above specifications would have to provide a strength that is
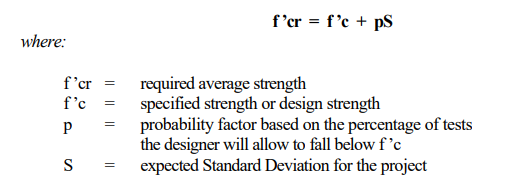
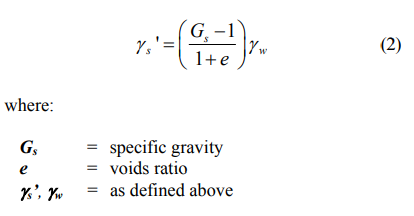
definitely higher than f ’c, called the required Average Strength (f ’cr). The Required Average Strength can be determined from the following formula:
Use of the Normal distribution curve to obtain the required average strength is illustrated in Fig. 3.1.
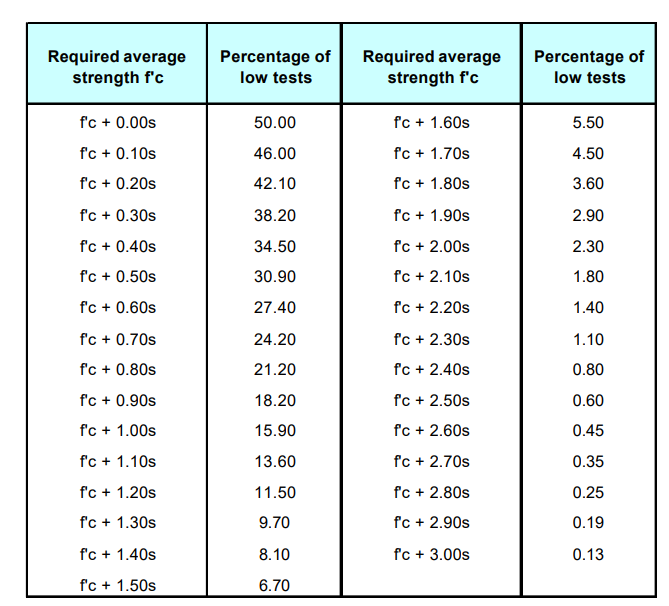
To calculate the required average strength, the Engineer must decide the specified strength and what percentage of tests falling below the specified strength will be allowed. When the decision has been made on an acceptable percentage of low tests, the probability factor can be determined using the properties of the Normal distribution curve. The probability factors for various percentages of low tests are given in Table 2 below:
The Standard Deviation S is obtained by analyzing the Concrete Producer’s data. Since the Standard Deviation for a project is not known at the beginning of a project, Chapter 4 of ACI 318 permits the substitution of a Standard Deviation calculated from at least 30 consecutive strengths on concrete produced at the proposed concrete plant using similar materials and conditions.
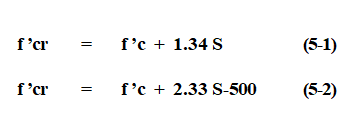
ACI 318 is more specific in the selection of the Required Average Strength f’cr to be used in the proportioning of concrete mixes.
ACI 5.3.2.1 States:
“Required Average Compressive Strength f’cr use as the basis for selection of concrete proportions shall be the larger of Eq (5-1) or (5-2) using a Standard Deviation S calculated in accordance with 5.3.1.1 or 5.3.1.2
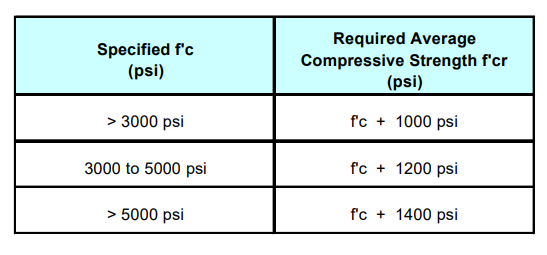
ACI 5.3.2.2
When a concrete production facility does not have field strength test records for calculation of Standard Deviation meeting requirements of 5.3.1.1 or 5.3.1.2, Required Average Strength fc’r shall be determined from Tabl3 5.3.2.2 and documentation of average strength shall be in accordance with requirements of 5.3.3.”
TABLE 5.3.2.2 – Required Average Compressive Strength when data are not available to establish a Standard Deviation.
Thus, from the foregoing, it can be clearly seen that there is a rational way of specifying concrete strength which would relatively be more economical than an arbitrary and ambiguous requirement that absolutely No tests fall below the specified f ’c. This implicitly means that the Designer is in effect specifying “stronger” concrete. Implicit with our understanding is the acceptance of failures within the batch but which are within acceptable limits on the number of failures. The Design Engineer therefore needs to have a more thorough appreciation and knowledge of the variable nature of concrete as a Civil Engineering Material and how he can control it through proper application of statistical methods not just by specifying “stronger” concrete.
Evaluation and Acceptance of Concrete
Knowing what to specify and what to expect in terms of the variability of concrete test results is only half of the picture.
Having a clear basis for acceptance/rejection is the other half.
This brings us to just exactly what is meant by a “Test”.
A test is defined in 5.6.1.4 of ACI 318 as follows:
“A strength test shall be the average of the strengths of two cylinders made from the same sample of concrete and tested at 28 days or at the test age designated for determination of f’c.”
A lot of times, Design Engineers or even Project Engineers reject a concrete batch on the basis of a single cylinder break and without due consideration of the established criteria for Acceptance/Rejection which are stated below:
“5.6.2.3 Strength level of an individual class of concrete shall be considered satisfactory if both of the following requirements are met: a) Every arithmetic average of any three consecutive strength tests equals or exceeds f’c. b) No individual strength test (Average of Two Cylinders) falls below f’c by more than 500 psi.”
4.0 STRUCTURAL STEEL
Similar considerations govern the use of structural steel in highly seismic regions such as what we are in.
Particularly for built up sections which are commonly used in the Philippines, Substandard Plates from some Eastern European Mills are passed on as A-36 Steel.
When tested, the steels exhibit very high yield stresses (High Carbon Content) and Tensile strengths just slightly above the yield stress.
In effect, these steels would exhibit Brittle or non ductile behavior during an earthquake. Thus collapse would also probably be sudden.
Why do these proliferate in the Philippines?
It is because of several things:
Lack of knowledge of the Brittle Behavior of the steel.
Unscrupulous suppliers who try to pass this on as A-36 or other acceptable specified grade steel
Plain ignorance on the part of the Designer, Specifier or Project Manager
Tests have not been performed.
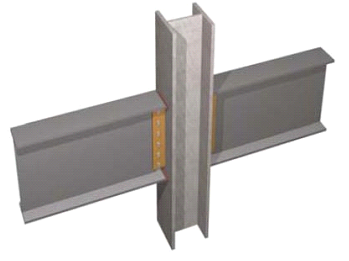
What is worse, if these are used with welded connections, serious incompatibility with the welding procedures specified for say A-36 steel and the high YS and TS steels could produce defective connections and embrittlement in the joints.
Again, sudden failure on the joints could result.
Often, the Design Engineer accepts these test results blindly since the steel strength test results are “Stronger” than was specified and therefore necessarily “Better”.
This is very much farther from the truth as the theme in this paper aptly applies:
“Stronger is not necessarily Better”
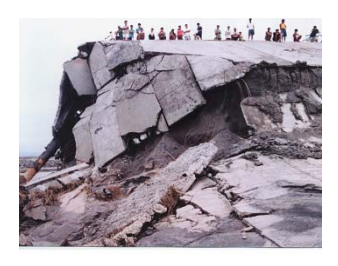
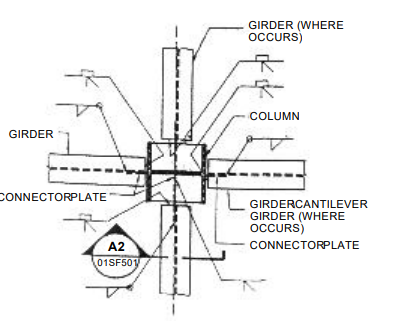
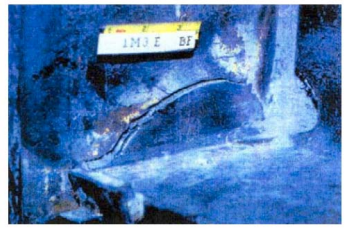
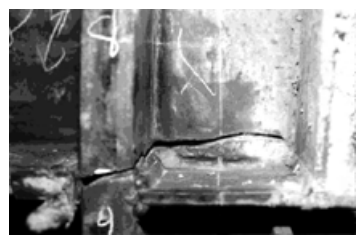
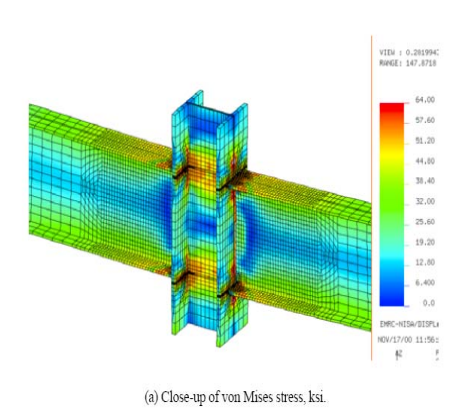
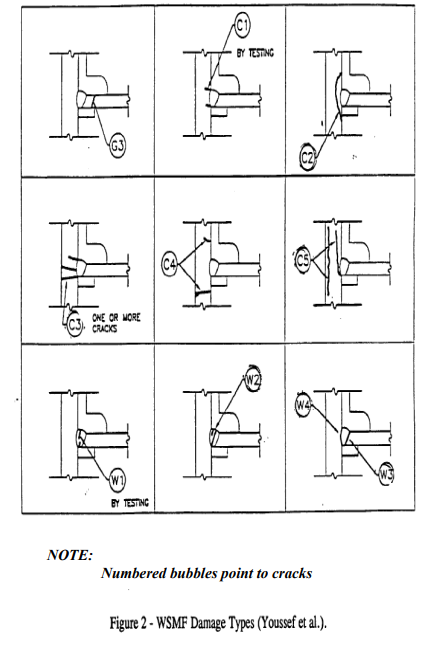
Although not within the scope of this paper, and since this has been extensively discussed in other fora, joints in structural steel complying with the current AISC and local codes have exhibited failures during the Loma Prieta Earthquake.
What does this tell us?
Making the joints compliant with what was then an existing code or even stronger does not guarantee proper structural performance.
5.0 SOILS
Soil is the ultimate structure on earth because all man made structures eventually rest on the soil. Extensive in occurrence, man has to contend with a highly variable material.
However, to some extentman can control the Quality of Soil through stabilization, amelioration or ground improvement and this is where the problem lies.
Always, the target is to produce a stronger material either by overcompaction or by stabilization.
Most of the time this is done in total ignorance of soil mechanics principles and soil behavior.
Compaction
The situation is best illustrated in the most extensively used procedure in Civil Works: – compaction
Compaction in granular soils is sometimes carried to extremes – Heavier compactors, – numerous passes more than what is required – just to make sure that what is attained is “stronger”.
Little do people know that overcompaction is not beneficial and in fact degrades the density initially obtained.
In clean granular soils subjected to overcompaction, the soils shears and density collapses beyond the optimal compactive energy (number of passes).
In cohesive soils, overcompaction results in remolding sensitive clays and causes strength loss.
In expansive or highly swelling soils, the compactive effort needs to be reduced and the Moisture Content kep wet of optimum to reduce swell potential and heaving.
In a former engagement, the author’s attention was called, as the results of Field Density Tests were being questioned vehemently by the contractor because the clean granular soils have consistently failed to meet specifications.
Upon investigation, the following observations were made:
The sub contractor was delivering from 9 to 14 passes on the soil with 15 MT vibratory compactors because:
Field Density Tests showed low densities consistently below the Target MDD after each day’s test.
Fuel is provided free by the Prime Contractor
Equipment is paid based on operating hours.
The soils are being compacted at “Optimum Moisture Content” (OMC)
Parallel Cracks transverse to the direction of compactor travel have formed in the overcompacted soils.
Trial compaction works were ordered and it was found out that only 3 to 4 passes were needed to reach specified densities.
In addition, it was finally made clear, but with much difficulty, that there is no “Optimum Moisture Content” when applied to clean granular soils. The Contractor all the while was taking pains in controlling moisture to OMC due to a lack of understanding of the behavior of clean granular soils subjected to compaction. The soil either has to be very very dry or very very wet before compaction to attain maximum density.
As a result, the subcontractor suffered a severe reduction in rental revenues as the compactor fleet was reduced by more than 50% although additional water tankers were needed.
The Prime Contractor in turn made substantial savings and the construction schedule was substantially speeded up.
Again this is another case where
“Stronger is not necessarily Better”
Why is OMC not relevant in Clean Granular Soils?
Let us look at the characteristic compaction curves for Granular Soils.
Looking at the compaction curve above for clean granular soils, immediately tells us that this is very much different from the normal parabolic shape of fine grained and cohesive soils. The twin peaks P1 & P2 indicate that the soil can either be compacted very verydry or very verywet and that OMC is not relevant
Instead of a Parabolic Shape, the “S” Curve can be clearly seen. The “Trough” between 0 to 12% MC (varies with soil type) is the bulking moisture content where surface tension of the moisture holds the grains apart. Thus density is low.
Without understanding the characteristic behavior of the soil in the Moisture Density Curve, very costly and highly erroneous compaction procedures would result.
Case where Building “Strengthening” caused more Distress
Another extreme reaction due to a wrong perception of Soil Behavior and its telltale effects happened in one project where we were involved to evaluate a Building that was “Sinking”.
Earlier remedial measures directed towards the mistaken assumption that settlement was occuring resulted in a costly but unneeded measure, but worse, it even aggravated the Structural Damage to the Building.
What was then wrongly perceived as “settlement” was in fact heaving. Since the perception of the direction of movement was based on guesswork, and because no tests were performed, incorrect or inappropriate remedial measures were implemented as follows:
Phase 1 – Extensive Structural Repairs and Strengthening were made on the Waffle Slab RC Deck.
Result : Distress continued despite the repairs.
Phase 2 – Because Phase 1 continued to “settle”, Piled Foundations were specified on the next Phase. In effect making the foundation stronger by using Piles to bypass “weak” soils. Result : The Piled foundations, rather than reducing the damage, caused more severe damage in a shorter period of time than the level of damage sustained by Phase 1 !
The two Buildings were badly cracked but as stated, the Pile Supported Buildings cracked more extensively and more severely than the unpiled structure !
Subsequently, during our investigation, we found out that heaving and not settlement was occurring. The only solution to arrest the cracking was to remove a layer of Base Course Material composed of slag from a Steel Mill.3]
The Contractor and Owner’s Project Engineer thought that slag being heavier and stronger would be better and cheaper than normal granular Base Course since it was available for the asking and compacts well. Unfortunately, the slab corroded under the very acidic ground water resulting in expansion and heaving.
“The “Stronger” Slag Base Course proved to be not only inferior but also caused heavy damage than a weaker material – in this case granular Base Course
Going back to the Piles, which were perceived to offer a “Stronger” Foundation, severe cracking and more extensive damage resulted from the restraint offered by the Piles which served as Anchor Piles preventing the Phase 2 Structure from rising.
The restraint on the Walls and Columns caused more severe cracking than the Phase 1 Building since the earlier building was founded on spread footings and was relatively more free to ride the heaving than a “Stronger” Pile “Supported” (Restrained) Structure.
In these two instances involving the R&D facility, wrong understanding of the soil behavior and lack of any tests done on the soils resulted in a very expensive but ineffective and far more damaging response to the problem.
Critical Engineering Judgment was definitely needed in this case.
6.0 CONCLUSION
The foregoing discussions and examples based on real world experiences show that sometimes wrong reactions or responses to the problem bring about unwanted consequences.
Particularly in the practice of our profession, the normal tendency when a problem occurs is to strengthen or use stronger materials to ensure an “imagined” factor of safety which in reality is a double bladed factor of ignorance !
We can not allow this to happen as this can cause unwanted and oftentimes dangerous outcomes.
We should strive to understand material behavior and the Environmental Influences which can alter or totally change the performance that we expect from our structures.
It is necessary for all of us gathered here to spread this message to our subordinates and apprentices so that the lessons of the past will not be repeated.
Emilio M. Morales CE, MSCE, F.ASCE, F. ASEP, F. PICE1 Mark K. Morales CE, MSc2
ABSTRACT: Civil Engineers are always confronted by the uncertainties in the subsurface that lie beneath their proposed or existing structures. While most often, soil borings would be adequate, in some applications this is not necessarily so as borings give detailed information but only at discrete locations and anything in between is “interpolated”.
GPR on the other hand, gives a continuous information stream of the subsurface along its scan lines. 3D visualization is also possible by using orthogonal mesh of scan lines and the mesh sizes can be varied to suit the requirements.
While it is not a replacement for the use of borings to determine soil design parameters at discrete locations, GPR is a very useful adjunct to the borings in gathering reliable information particularly in-between borehole positions.
In problematic areas such as in Karst terrains or in areas with suspected Geotechnical or Geologic anomalies or even man made buried objects such as Ordinance or buried pipes, a continuous visualization of the subsurface is necessary in order to identify problem areas and thus enable an adequate plan of action when designing the substructure or determining what lies underneath.
Particularly in large projects, surprises in the subsurface have cost significant increases in the construction budget and/or resulted in large time delays.
Ground Penetrating Radar (GPR) has been used successfully worldwide for the location of buried objects and mapping the subsurface stratification more clearly.
In this paper, we wish to share the underlying principles on the use of GPR and also highlight various successful applications of the technology in solving day to day Civil Engineering problems.
1. INTRODUCTION
Often we are confronted with the need to determine that what lies underneath a project. Sometimes, borings may not be adequate to give a detailed picture of the subsurface. This is critically important in the case of suspected presence of Geologic or Geotechnical anomalies such as faulting, cavities or manmade objects and even explosives.
Particularly where the exact location of the anomaly is unknown, the use of non invasive methods would avoid the large disturbances and disruption that excavation or borings would bring.
Thus, Geophysical Methods such as Seismic Refraction SR and Ground Penetrating Radar GPR come into the fore in providing a clear visualization of the subsurface. Of these, GPR comes as a good candidate for this purpose.
2. BACKGROUND
This Paper presents our local practical experience in the deployment of Geophysical methods, most specifically GPR to address and provide solutions to various practical problems where conventional approaches may not give adequate information or may not provide it in a faster or more accurate way.
Although Geophysical methods address the need for more information compared to conventional borings, these are not substitute to actual soil borings when soil design parameters (strength and compressibility) are needed.
However, borings may provide only limited discrete information points or are limited because of budgetary restrictions while Geophysical methods may provide a continuous data stream or even three dimensional images of the desired target of interest. Thus these two methods are complementary and would provide a more meaningful information record when done together or when augmented by each other.
One of these valuable geophysical methods is Ground Penetrating Radar or GPR.
3. ORIGIN
Ground Penetrating Radar Technology was an offshoot of the military use of radar and was spurred by the need to do research in the thick ice of the Polar Ice Cap. The developed technology has now also reverted to military use again in the detection of buried mines (IED’s) and arms caches.
3.1 USES
Used for detection of Cavities, caves and other Geologic Anomalies such as buried faults.
Used for detection of Buried objects such as pipes, IED’s and Archeological artifacts
Used for environmental scanning to determine waste landfills and pipeline leaks.
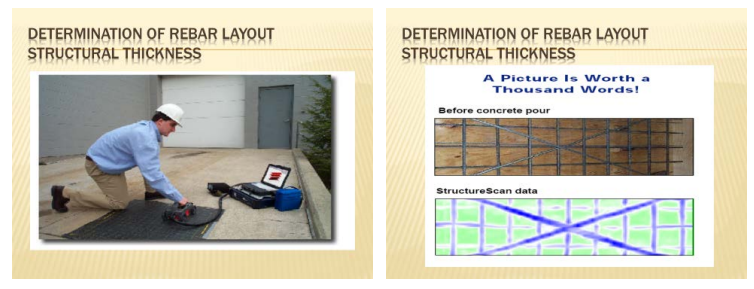
Used For determination of structural thickness of Roadways and pavements
Used for detection of Rebars and other embedded Objects in Concrete.
4. BASIC EQUIPMENT DESCRIPTION AND OPERATION
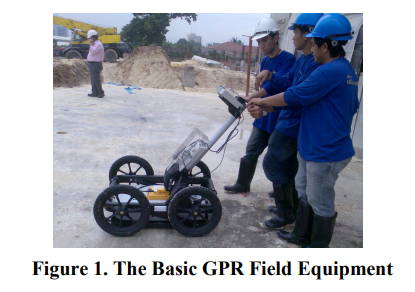
4.1 Equipment
The basic field equipment consist of the Control Computer, the Electro Magnetic Pulse(EMP) Antenna and the Cart with the associated power supply and distance measuring device which is synchronized with the computer to give accurate distance readings with the scanned images. There is also an option to connect this with a Global positioning system or GPS.
MALA PROEx Control Unit with power supply with internal calibration routines built in.
MALA Optical Module – connects to all antennas through high speed fiber optic cables.
MALA measuring wheel used for automatic distance measurement and control of the survey line.
MALA XV Monitor – the dedicated monitor includes all bult in software (Groundvision Software) to view the survey and process the profiles without the need for a laptop.
MALA Rough Terrain Cart – contains all the GPR equipment and accessories including the distance measuring pulse encoder.
4.2 Operation
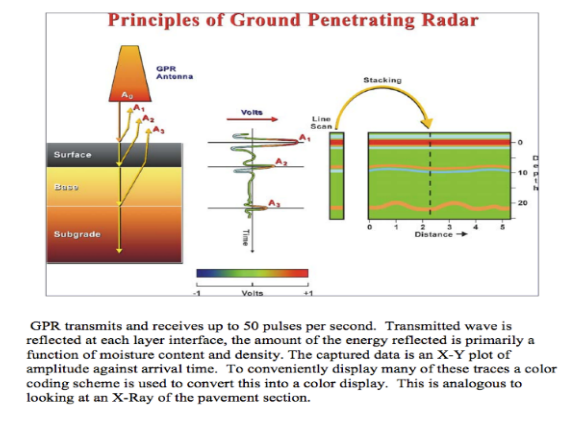
More simplistically, radar impulses are transmitted at a frequency of 100 to 500 kHz from the equipment and are bounced back or absorbed by objects depending A receiving antenna receives the bounced signals or pulses and are processed by computer in Real Time to provide a computer image of the subsurface. on the material stiffness and saturation and other interferences. See Figure Below: 3]
The choice of Ultra magnetic Impulse Frequency to use determines the effective depth for exploration. The Frequency is inversely proportional to the effective depth of exploration. Very high Frequencies are used for shallow depths such as for roadway pavement structure investigation where a continuous record of the pavement structural thickness to the nearest millimeter is desired for dispute resolution or for QA and audit purposes.
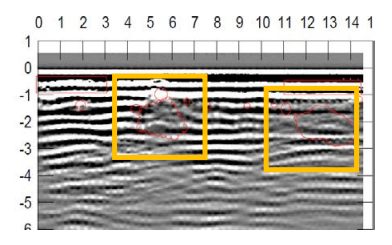
5. IMAGE POST PROCESSING AND INTERPRETATION
After the initial field scanning and data gathering, the image is post processed in the office using proprietary data interpretation software such as OBJECT Mapper, EASY 3D and GROUND Vision.4
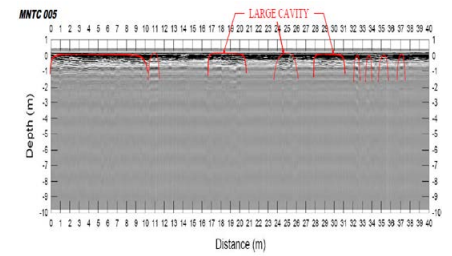
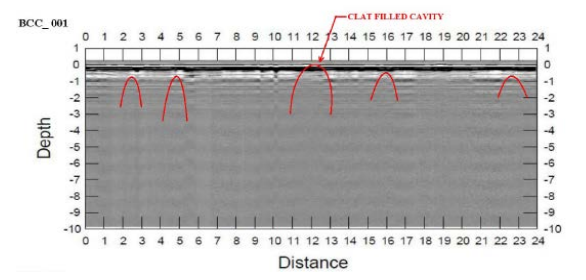
Figure 2. The figure above shows the GPR SCAN IMAGE showing the locations of detected cavities
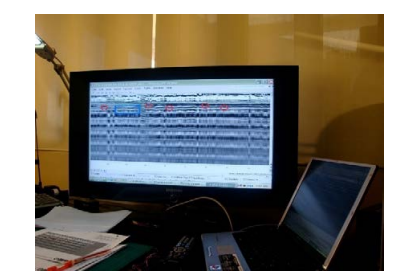
The image is post processed in a high Resolution large screen TV Monitor and desktop computer using the applicable software.
Figure 3. Image Processing using High Resolution TV Monitor
Cavities or anomalies show as distinct features in the post processed scan with characteristic signatures or shapes.
Cavities are displayed as hyperbolic shapes and solid obstructions such as buried concrete as very dark parallel lines.
Soil stratification or layering are also discernible due to the different contrasting layers with various shading and strengths. The darker the shade the stiffer or harder the layer encountered.
In some cases, pipe leaks can also be discerned due to the disaggregated stratification and large disturbed lines in the vicinity of the pipe leak breaking the layering or stratification.
With the additional software tools, visualization in 2D & 3D are easily made because of the large contrasts in the image as well as the characteristic signatures of anomalies and obstructions in the subsurface.
Thus, as an example, the location of abandoned piles or the presence of buried structures and even unexploded ordnance such as bombs or shells can be detected provided these are within the scanning path of the equipment.
6. LIMITATIONS OF TECHNOLOGY
The presence of highly saturated plastic clays would tend to mask the radar signals and may produce no radar image at all or very hazy ones leading to some inaccuracies in the procedure. In addition, the presence of surface obstructions such as concrete pavements, the presence of subsurface boulders and other objects would tend to affect the accuracy of the signals and the images generated.
In highly conductive zones, such as saturated montmorillonite clays or saline marshes, it is almost impossible to obtain useful results below 1-2 wave lengths of the antenna. 5
7. PRACTICAL APPLICATIONS
7.1 General
The following applications are discussed to illustrate the versatility of the GPR equipment in seeing the unknown.
Most of these applications were done with basic scanning procedures using a 250 MHz antenna.
7.2 Detection of Fortune Hunting Tunnel
We conducted the soils exploration program for this facility consisting of several buildings in Lahug, Cebu. Several borings indicated cavities at approximately 20.0 meters depth. Originally these were suspected as cavities in the Karstic limestone environment of the area. However, because of the consistent depth of occurrence and the size of the cavity as detected in the borings, we tried to trace the occurrences. Through enough, the trace started from outside and continued towards the main building. We recommended the conduct of additional borings and GPR scanning of the area. The owner did not approve this as the depth and size of cavities were very small.
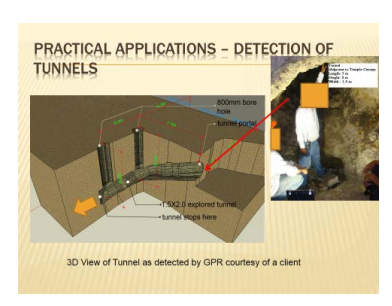
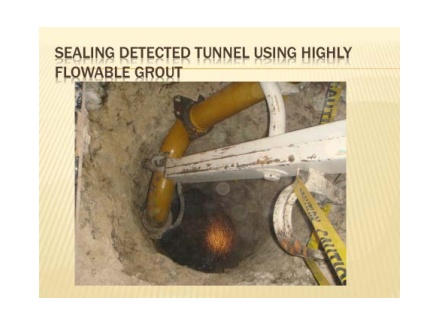
However, towards the completion of the main building and during the excavation of storm drainage, the tunnel entrance, daylighted near the edge. Further probing indicated that it was indeed a manmade tunnel. The pictures and the illustration 6clearly show what has been initially suspected as solution channels was in fact a fortune hunting tunnel.
The results of the GPR scanning revealed and confirmed the general Tunnel alignments earlier revealed by the Subsurface Soil Exploration Program conducted for the Temple facility.
In addition, a separate Tunnel alignment was indicated along the Housing area and possibly continuing towards the parking area at the NW corner of the Main Parking. Generally, the GPR scans as stated agreed with the general Tunnel alignment for the main tunnel detected during the site soil exploration.
The main tunneling effort was directed towards the Main Hill as the old villa in the hilltop was used by the Senior Japanese staff for Lahug Airfield. It has always been common knowledge that where the Japanese Generals are billeted, buried treasure can be found.
Figure 4. A 3D sketch of the Tunnel System as discovered by GPR and verified by subsequent investigation at the portals
Thus, it is possible that the tunnel would have continued towards the old house footprint where the Tunnel is approximately situated although this cannot be ascertained as the building mat foundation has already been constructed.
As a result, the main tunnel and the branch tunnels were ordered sealed with concrete grout with the former taking in 7 Transit mixer Loads of concrete and the latter another 5 Transit mixer loads.
Figure 5. The Hyperbolic Symbols indicate the presence of small shallow cavities exposed during excavation
7.3 Detection of Cavities under Buildings
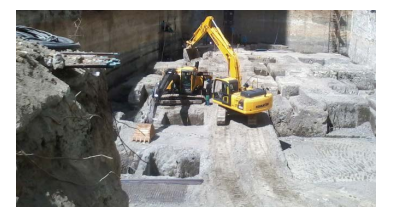
7.3.1. Basement Excavation
An excavation for multi-level basement uncovered initially large cavities that were daylighted by the excavation. We were requested to undertake GPR scanning to verify if there are any more hidden cavities underneath the level of the mat foundation.
However, suspected voids filled cavities, which are not of significant size have been inferred from our scanning profiles as well as several manmade structures such as footing tie beams.
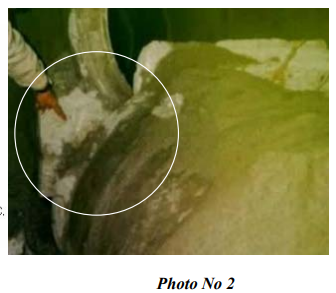
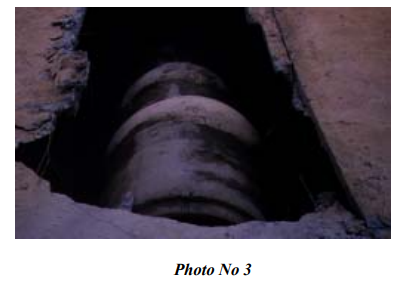
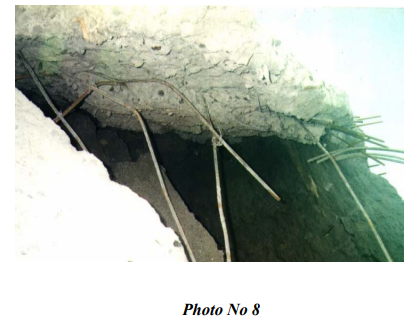
Visual manifestations of some exposed tunnels were evident at the footprint of the building within the basement excavation. These were photographed and also marked in our plans. These discovered large sized tunnels prompted the conduct of GPR scanning in order to locate any further occurrences.
Some of these tunnels that have daylighted are relatively large and are either hollow or filled partially with soil or decayed organic materials.
The GPR survey at the basement has not detected any hollow tunnels or cavities comparable in size to the cavities earlier excavated and daylighted by the contractor for the basement excavation.
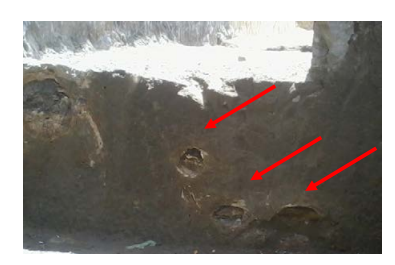
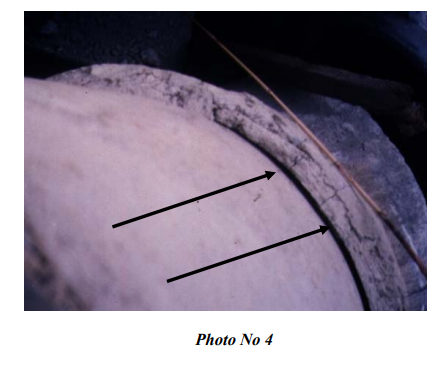
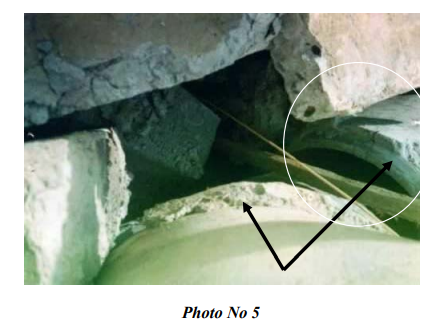
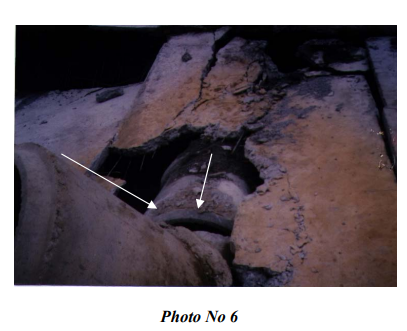
Figure 6. The picture shows the occurrence of cavities (arrows) which are filled with Organic Materials
The cavities as detected were relatively very small and possibly the locations for fossilized tree roots or vegetation.
Thus construction proceeded for the mat foundation without any concern on the presence of cavities.
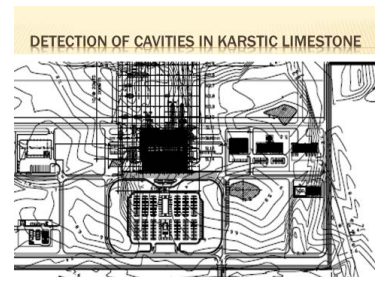
7.3.2. Cavities and Solution Channels in karstic Limestone
The site of a proposed airport is underlain by Karstic limestone which is known to have major cavities and solution channels in a Southern Visayas Island.
We were asked to undertake borings and GPR scanning in order to map or delineate the extent of the cavities.
Figure 7. Partial view of Apron area with identified cavities
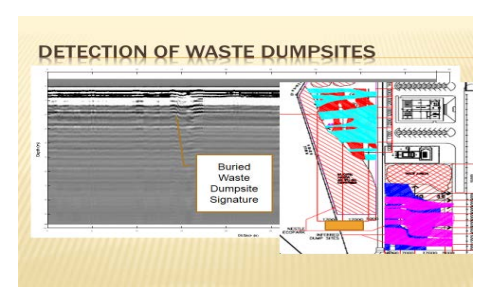
7.4 Detection of Buried Waste Dumpsite
We were asked by a client to survey and delineate suspected waste dumpsites within their factory which was buried a long time ago.
We conducted a grid survey with orthogonal scan lines spaced 10.0 meters apart in both directions.
The GPR scanning identified the location and extent of the dumpsites which we then mapped and referenced against the plant grid coordinate system. The detected landfill were earmarked for disposal outside the plant battery limit to an approved Sanitary Landfill.
Figure 8. The Differences and Contrast of the layers are evident. The waste is identified by dark and light layers. The Light blue color in the map indicates the horizontal extent of the waste Landfill.
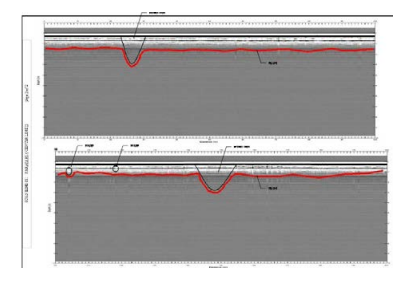
7.5 Detection of Buried Creeks and Depressions
Sometimes, in the haste to make land saleable, land development was done haphazardly, and creeks and depressions were hurriedly filled with pushed over materials that are uncompacted. These have often caused problems when structures are built over these areas, as settlements and deformations may result when the pushed over material is loaded.
The figure below shows a creek which was filled with loose fill and covered by compacted material above the creek.
The creek shown by the depression is shown as well as the NGL portrayed by the bold line. The two images were taken at 20 meter offsets and when represented in plan , show an inclined creek crossed by the perpendicular scan lines.
7.6 Detection of Leaks Under Tanks and Pipelines
In one occasion, we were engaged to undertake detailed scanning inside a food factory where old sewer lines and storm drains were buried under the factory floor. The objective was to locate the decommissioned utilities, but more importantly, to locate the source of the leak in a sewer line that is mixing with the storm drain and thus causing a concern due to cross contamination.
Numerous unsuccessful attempts were tried before in locating the suspected leaking pipes causing disruptions in the operations as these have to be excavated at the suspect locations.
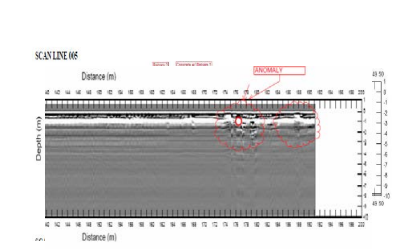
Figure 9. Shows the image of two pipes in parallel both causing upheavals in the subsurface immediately below indicative of a leak
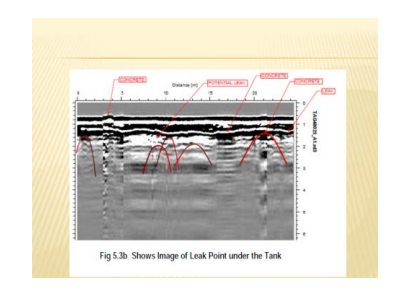
In another engagement to detect cavities and solution channels, we were able to detect a leak point underneath a water tank as shown by disruptions in the soil layers underlain by cavities in karstic limestone. Dissolution of the limestone can create a sinkhole which can collapse the tank.
Figure 10. The figure above shows a buried pipe with tell tale signs of upheaval in the layering possibly caused by leaks.
7.7 Detection of Buried Utilities
Buried utilities are a concern particularly during excavations or even during borings at a site. For utilities, where as-built plans have not been prepared accurately, it would be difficult and sometimes even dangerous to undertake invasive methods or excavations without scanning the subsurface. This is particularly true in the case of pipelines for Petroleum or LNG or other lines such as water mains. Provided that the scan lines are Orthogonal to the pipe alignment and the scans are done at regular intervals, a 3D visual image can be generated using software post processing.
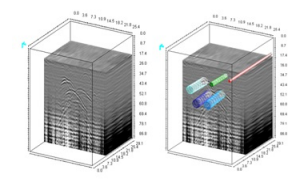
Figure 11. 2D and 3D Visualization of a Pipeline using Software Postprocessing
7.8 Very Shallow Non-Invasive Scans
Where shallow non-invasive scans are needed particularly in large area scans or relatively very long alignment investigations, there is no substitute to the use of GPR for mapping the subsurface. However, a higher frequency antenna is required as the depth of penetration varies in an Inverse proportion to the Antenna frequency. The Lower the frequency, the deeper the depth scanned.
Figure 12. The figure above shows the presence of pipes as well as buried concrete with the rebars showing as closely spaced block dots
7.8.1. Roadway Pavement Structural Investigation and Audit
The pavement structural thicknesses of roadways can be determined either at discrete locations or as a continuous stream when connected to a GPR and a vehicle pushed or drawn GPR system. The alignment locations are automatically linked by GPS to the GPR records and even to a real time video.
This is particularly useful when making pavement condition surveys or when doing QA verification of the as constructed pavement structural thicknesses.
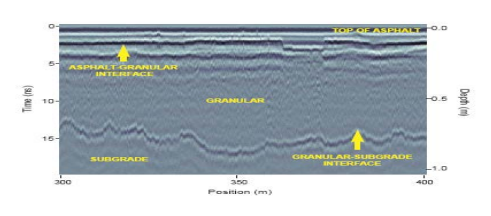
Figure 13. A vehicle system with the GPR and GPS is used for continuous Roadway surveys 7]Figure 14. A section of an AC pavement along the alignment showing the layer thicknesses to within a millimeter accuracy (by scaling the depth)7]
7.8.2. Detection of Embedded Rebars and Conduits in Concrete
Another practical use for a GPR system is the determination of Rebar layouts or embedded conduits in concrete structures.
Figure 15. The scanning and actual layout vs the scanned layout is shown in the above pictures from Mala Geosciences
8. SUMMARY AND CONCLUSIONS
GPR as shown in the examples can be truly versatile equipment in helping the engineer see the unknown and in the process make more informed decisions about his project or solutions to problems confronting him.
GPR allows a clear visualization of the subsurface in 2D or 3D. Intelligent deployment of the technology requires a keen eye to detect the anomalies and their differing signatures. However, with more advance software for post processing, the GPR becomes a very powerful tool indeed in the hands of the Engineer.
1] Emilio M. Morales CE, MSCE , Carnegie Mellon University, Principal EM2A Partners and Co., former Senior Lecturer, UP School of Engineering, Graduate Division, Chairman, ASEP NSCP Code Update Committee, Chairman, ASEP and PICE Geotechnical Committees.
2] Mark K. Morales CE, MSc University of California, Berkeley, President PGA Earth Structure Solutions, Instructor, UP School of Engineering, Graduate Division.
3] REF 1.0 From Internet Download TEXAS DOT Presentation of GPR in Civil Engineering 4] Mala Geosciences SOFTWARES
5] SEGJ. “Application of Geophysical Methods to Engineering and Environmental Problems”. Advisory Committee on Standardization, The Society for Exploration Geophysicists of Japan, 2004.
6] Illustration and photo courtesy of Engr. Rommel Fajardo.
The tragic loss of 58 lives in the Cherry Hills landslide attracted a lot of Philippine & International media attention and with it a lot of speculations and rumors as to what caused the slide. Several professional organizations and government agencies were also involved in the various studies and investigations to understand what really happened. This report summarizes and documents the work of the committee, including the methodologies and tools employed in reconstructing the conditions before and after the landslide, its findings and conclusions. This paper summarizes the collective independent findings and conclusions of the authors.
I. INTRODUCTION
Right after the Cherry Hills Landslide, which occurred on the night of 3 August 1999, the Philippine Institute of Civil Engineers (PICE) and Association of Structural Engineer of the Philippines (ASEP) mobilized members of its Geotechnical Committees in order to volunteer its services in the documentation of the Cherry Hills Landslide. The intention was to focus its attention on the Engineering aspects of the overall investigation. It was necessary to understand what caused the landslide, how the landslides occurred and how such mechanism/s can be prevented or avoided in the future. It is the intention to disseminate this report to all interested parties and to the Engineering Profession in particular so that lessons learned can be applied to prevent future similar accidents.
2. BACKGROUND OF CHERRY HILLS LANDSLIDE
(1) Location of Cherry Hills Subdivision
The subdivision is located in Antipolo City, Province of Rizal, Luzon Island, the Philippines. It is situated in saddle like fashion in an elevated terrain cut from a mountain leaving the East and West Flanks.
It is flanked by two subdivisions, Park Village Subdivision to the North and Peace Village to the South. The East and West flanks are bounded by the mountain sides left after the cut. The Eastern Summit is at elevation 255m Map and the Western side is at elevation 233m. The subdivision cut from the mountain side is approximately 26m at its deepest.
(2) Extent of Development of Cherry Hills
The subdivision encompasses an area of approximately 5 Hectares. All the roads have been paved with plain Portland cement concrete. The subdivision residential units consist of two and single storey houses that are either single detached or row housing. These are light roofed houses with hollow block wall construction and reinforced concrete columns on isolated footings.
(3) The Landslide
The landslide occurred at approximately 7:00 PM of August 3, 1999. Several hours before the event a lot of residents have evacuated their homes because of telltale signs of the impending slide. Cracks were being observed in some houses which continued progressively, thus, providing ominous signs that were heeded by some.
When the landslide occurred, it was very sudden and according to some eyewitnesses, occurred within five seconds. Two loud noises were heard during the landslide. Fifty Eight (58) lives were lost and one unaccounted for in this slide event.
Interviews with some homeowners indicated that there have been manifestations of movements in the Subdivision platform (creep) as manifested by crackings on the walls and difficulties encountered in the closing and opening of doors and windows. this happened several months before the landslide.
3.0 DATA GATHERING FOR THE ENGINEERING STUDIES
With the data already collected on the Geology of the area and specifically the orientations of bedding planes and joints in the rock mass, the Geotechnical Investigation Team concentrated on the following objectives:
(1) Data Gathering
a) Reconstruction of the Digital Terrain Model (DTM) of the area from the National Mapping and Resource Information Agency (NAMRIA). Maps were done as the reference point for the subsequent subdivision development, to establish platform elevations.
b) Mapping of the slide zone and Cherry Hills Subdivision in relation to the existing Digital Terrain Model by Global Positioning System (GPS) Surveys.
c) Gathering of subsurface data by conducting soil exploration in the slide zone and the undisturbed areas.
d) Gathering of intact block samples for strength testing of cores obtained and classification of soil samples using the Unified Soil Classification System (USCS).
e) Extraction of rock cores from intact blocks and simulation of the effects of groundwater conditions on intact cores through saturation (obtained from within the same sample block).
(2) Analysis of Strength Data
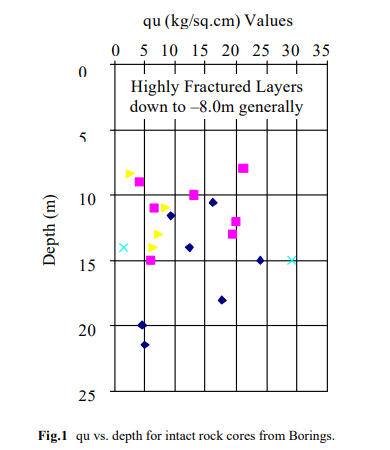
Numerous Unconfined Compression Tests (UCT) were conducted on intact cores obtained from borings and from corings done on block samples gathered from the slide areas. The cores consisted of the various layers of sandstone and the thin siltstone seams interbedded with the sandstones. The results of the Unconfined Compression Strength Test show the range of values of Uniaxial Compressive Strength (qu) of the rock layers in the area.
The Scatter Chart in Figure 1.0 below shows the values for both rock types obtained from the borings.
Although these represent the material strengths of the intact rocks from a generic sense, it does not give an idea as to the actual Characteristic Rock Mass Strength (CRMS) during the slide. The Characteristic Rock Mass Strength is the “average” strength of the rocks along the failure plane at failure.
For determining the latter, it would be necessary to consider the degree of jointing, weathering and the other environmental factors that could affect the characteristic strength.
The Uniaxial Compressive Strengths from intact cores served only as the reference base or starting point from which approximations of the CRMS at impending slide could be obtained. This will be discussed subsequently.
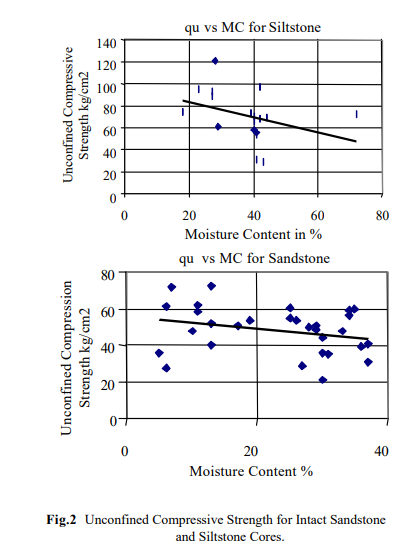
(3) Effect of Water Saturation on Strength of Cores
The cores from within the same block samples were grouped and subjected to immersion for 24 hours, 48 hours and 72 hours.
The plot of the Unconfined Compressive Strength qu (kg/cm2) vs. Moisture Content (%) is presented in Figure 2.0 for Sandstone and Siltstone Cores.
The trendline indicate the decrease in qu with increasing moisture content clearly establishing that water saturation could have an effect on the strengths.
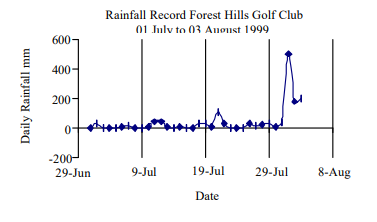
(4) Climatic Effects
The unusually wet weather and abnormally high rainfall occurred in the months before the landslide. This was preceded by the El Niño which in contrast is characterized by extended droughts and unusually very dry and hot climate. This phenomenon was followed by abnormally high rainfalls in the months and days immediately preceding the slide. (Fig. 3.0)
Fig.3 Rainfall Chart Preceding the Landslide Event
(5) Test for Expansion Potential
The siltstone materials were pulverized and tested based on the Unified Soil Classification System (USCS).
All the siltstone materials classified as “MH” (Highly Plastic Silt). The very high Atterberg Limits. Liquid Limit (LL) values (>75%) and the relatively high Plasticity Indices (PI) (PI=LL– PL>20) indicated that the siltstone is moderate to highly expansive and therefore subject to shrink and swell cycles.
A further test was undertaken by subjecting sample to swell pressure test. The test confirmed that the siltstone material MH (Highly Plastic Silt) was really moderately expansive as it generated a confined swell pressure of 42.6 Kpa (890 psf).
This could have contributed to the disturbance and movements in the upper layer joints from shrinkage and expansion prior to the slide after saturation.
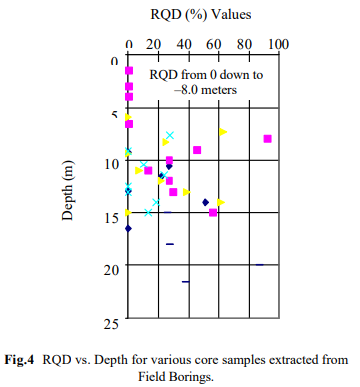
(6) Results of Field Borings
The Field Borings aided in characterizing the subsurface materials both within and outside the slide zone. It also indicated the depth and extent of disturbed materials of the slide zone and the groundwater conditions at the site after the slide.
In addition, it gave an indication of the Rock Quality through the percentage core recoveries and also through its Rock Quality Designation (RQD) values. The plot of the RQD values taken from the immediate area from 4 Boreholes and numerous core samples are shown in a Scatter Chart, Figure 4.0.
The RQD values as can be seen are relatively very low and indicate the highly fractured condition of the rock materials even in the undisturbed areas.
4. ENGINEERING STUDIES AND ANALYSES
(1) Determination of the Characteristic Rock Mass Strength (CRMS)
The shear strength of an intensely fractured rock is difficult to obtain as it would be difficult, if not impossible, to recreate or model the jointing and orientations of the rock under a full scale load test of the slope.
Wyllie1) stated that structures founded on Fractured Rock containing no distinct fracture surface on which sliding can take place, may still fail in shear if the shear strength of the rock mass is exceeded.
Because of the inherent difficulty of sampling and testing large samples of Fractured Rock, Wyllie proposed two empirical methods for determining the shear strength of the rock masses. These two procedures are:
a) Back analyses of the failed slope setting the Factor of Safety equal to 1.0 and obtaining paired values of cm and Phi by varying the value of “cm“ and getting the corresponding Phi value. These paired values are then compared to historical records of slides that have been analyzed in the past using this same procedure.
b) Substitution into a formula using the Hoek Brown criterion in order to obtain values of cm and Phi by drawing a Mohr’s Circle diagram of the failure condition.
The engineering analyses procedures adopted in this report followed these two empirical procedures as recommended by Wyllie to obtain values that could be used for the ensuing stability analyses.
The engineering studies and analyses took into account the following information in order to reconstruct the slide mechanism:
a) Geometry of the slopes prior to the development of Cherry Hills as a Subdivision.
b) Post Development Slope Geometries and existing platform elevations prior to the slide.
c) Analyses of the slide geometry and locations of various landmark features.
d) Review of the air photos and their interpretation.
e) Recorded observations from various photographs of the site during the various field trips including location of displaced vegetation, houses, streets, etc.
f) Results of the Subsurface Soil Exploration, Test Pits and Laboratory Tests conducted.
From the foregoing, a composite picture could be formed and a fairly reliable model of slope geometry before the slide could be obtained.
(2) Slope Geometry Determination
Slope Geometry was obtained and verified from the results of the DTM and the GPS Surveys.
(3) Approximation of Rock Mass Strength
Closely or intensely jointed rocks behave more like particulate materials (soil like behavior) when disturbed and exhibit spoon shaped or stepped path slides at failure. Thus, it would not be correct to rely on the intact core strengths for a back analysis of the slide as it would invariably yield very high factors of safety.
In a similar vein, it would not be correct to expect that the intensely fractured Rock Masses would behave and move as huge intact blocks (Topples) as would normally be expected for less closely spaced jointed rocks.
Bieniawski2) developed an empirical approach to classifying highly jointed Rock Masses by the Rock Mass Rating (RMR). The RMR is a qualitative procedure to characterize fractured rocks. Based on this, the approximate RMR value for the Cherry Hill Rocks is as follows: RMR Sandstone = 30.
The RMR is in turn used by Hoek to quantify the shear strength of Fractured Rocks by yielding“m” and “S” values which could be applied to formulas to yield the characteristic shear strength of the Rock Mass based on a curvilinear failure envelope. The “m” and “s” values as quantified by this procedure and used in this study are as follows:
Sandstone: m = 0.275 s = 0.00009 Siltstone: m = 0.183 s = 0.00009
(4) Back Analysis Procedure
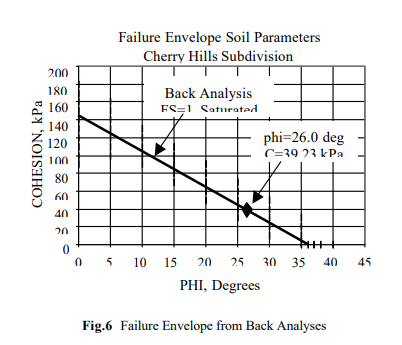
To complement the empirical procedure of determining the characteristic strength of the Intensely Fractured Rock. Wyllie also proposed the use of Back Analysis of the Failure.
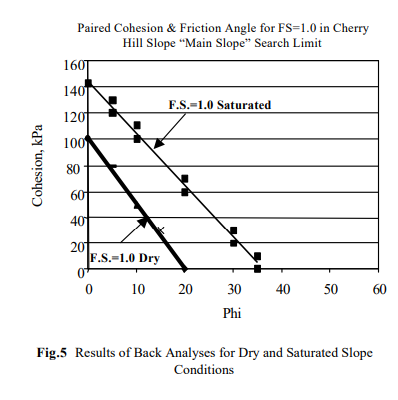
This procedure required carrying out a slope stability analysis with the factor of safety set at 1.0 (F.S. = 1.0) and using available information on the position of the failure surface, the ground water conditions at the time of failure, etc. This procedure however involves two unknowns, the Friction Angle “ϕ ” and the cohesion “c”. A number of stability analyses needed to be carried out with a range of cohesion values used to yield corresponding Friction Angle Values (ϕ ) by always setting F.S.=1.0.
The paired values (c, ϕ) obtained were then plotted in a chart of Cohesion vs. Friction Angle as shown in Fig. 5.0.
From this chart can be selected the most likely (c, ϕ ) value to be used. While the “exact” (c, ϕ ) value at failure may not be known as there probably are other localized factors involved, the values obtained could give a fair approximation of the characteristic strength along the failure plane at impending slide.
5. SLOPE STABILITY ANALYSES
Slope stability analyses were performed using Slope/W, a proprietary Slope Stability Analysis Program. SLOPE/W is a stability analysis program that uses the limit equilibrium theory to solve for the factor of safety of earth and rock slopes using various methods (Bishop, Janbu, Corps of Engineers, Morgenstern and Price, etc.) The analyses consisted of runs at various stages in the predevelopment and development stages culminating in the final condition leading to the landslide.
The initial stability analyses performed generally used an assumed homogeneous soil mass and arbitrary strength parameters for the various layers, in order to initially identify possible failure modes and their locations. Subsequent analyses used the geologic model and layering sequences based on the Geologic Profiles.
(2) First Pass “Slope Stability Analyses”
A conventional “First Pass” slope stability analysis was conducted using the Characteristic Fractured Rock Mass Strength in order to define potential failure planes. This would aid in identifying where the critical conditions are, based on the slope geometries and characteristic Rock Mass Strength. Cohesion and Friction Angle (cm and ϕ m). The computer program was allowed to automatically search for these critical slip circles from which candidate locations as defined by low factors of safety were recorded. In addition, the search area was also concentrated on suspect critical areas in order to fully understand how the slide occurred and whether there was a single massive slide or a sequence of slides occurring one after the other within a few seconds.
(3) Back Analyses Result
The procedure was conducted for both dry and saturated slope. (Figures 5 and 6)
It is significant to emphasize what the above plot is telling us, which are:
a) For the same failure situation (FS=1.0) higher strength parameters (c & ϕ ) would need to be mobilized at saturated conditions to prevent failure. (Failure occurs at higher strengths)
b) Conversely, for dry conditions, lower strength parameters (c & ϕ ) would suffice to prevent a failure condition from occurring.
Thus, we can say that failure during high saturation and consequent pore pressure buildup was the most likely mode of failure.
The family of points show the possible combinations (paired values) of (c & f ) likely to cause failure. From within these paired values probably lie the characteristic Rock Mass Strength at time of failure.
(4) Final Slope Stability Analyses Results
The back analyses generally confirmed and agree with the actual slide geometry. The rotational component of the actual slide is clearly explained by the results of the slope stability analyses.
The results clearly indicate that the main failure mode is rotational and that the block sliding mode is less critical.
It also clearly shows that without saturation, failure would be remote.
6. VARIOUS INFLUENCES IMPACTING ON THE SLIDE INITIATION
(1) Climatic Effects
The Philippines encountered extremely severe prolonged draughts brought about by the El Niño Phenomenon. This extended period of extremely dry weather could have induced dessication and shrinkage cracking of the siltstone layers thus causing it to weaken.
Clay infillings on major joint systems could also have been induced to crack due to shrinkage from extremely dry weather.
Unfortunately, El Niño was immediately replaced by the unusually heavy rains which was totally the opposite of the El Niño. Periods of heavy constant rainfall were encountered in the month before the landslide event.
The two weeks preceding the landslide have seen the heaviest rainfall in the area in many years with the last 3 days immediately before the major landslide event the heaviest ever encountered.
The shrinkage caused by extremely dry weather induced cracking on the clay infilling of the joints, thus, further weakening the strength of the intensely jointed rock and causing some movements to occur.
The extremely heavy rainfall in turn induced the injection of water into these cracks and joints causing the following effects:
Increased seepage and infiltration into the joints causing widespread lubrication of the Highly Fractured Rock Mass.
Increased buoyancy or uplift effects, thus reducing effective stresses significantly.
Increased water pressure induced swelling and expansion of the highly expansive siltstone layers causing heaving and disturbance of the intensely fractured rocks at some locations.
Increased saturation induced weakening of the siltstone by as much as 35% based on simulated saturation conditions performed in the laboratory.
The very heavy rainfall in the weeks and days immediately preceding the Cherry Hills landslide event had contributed a critical part in the initiation of the slide. In fact, several other minor landslides in the areas surounding Cherry Hills were triggered days before the Cherry Hills landslide because of the heavy rainfall. Thus, clearly indicating the critical role of water saturation and buildup of pore pressure on the slide.
In this investigation, the only means to quantify or recognize the impact of water saturation in the analyses procedures were as folows:
Strength degradation of the siltstone and sandstone layers by taking the mean strength at 72 hours saturation of the sandstone and siltstone layers as the intact Unconfined Compressive Strength qu (r) for use in the Hoek Brown formula and the back analyses of the slope stability.
Taking into account the elevated phreatic line in the slope stability runs and thus also implicitly admitting the reduction in the effective stresses due to the elevated water table.
However, these effects in themselves were very significant as indicated by increased Factor of Safety at unsaturated (Dry) conditions and the very low Factors of Safety (Failure) resulting from the analyses simulating the above saturation conditions.
(2) Strength Degradation of Rocks
The results of the laboratory tests on the Siltstone layers obtained from intact block samples in the slide areas clearly established the Potentially Expansive nature of the siltstone layers as evidenced by:
Very high Liquid Limit (LL) and Plasticity Indices (PI) averaging 80% and 22% respectively classifying therefore as MH.
Generated Swell Pressure of approximately 802 psf in the siltstone sample subjected to confined swell pressure tests.
Disintegration of cores when subjected to immersion after cooling from oven drying, crudely indicating or simulating the susceptibility to degradation due to drying and saturation effects.
Significant strength degradation due to swelling and volume changes of siltstone core samples subjected to varying periods of water immersion (24, 48 & 72 hours).
Strength degradation of the siltstone layers was significant and movements in this layer due to shrinkage cracking and expansion due to prolonged water saturation could have affected or disrupted the insitu characteristic strength of the intensely fractured rock masses as to also have a contribution to the initiation of the landslide.
(3) Sandstone Layers
Strength degradation from saturation of the sandstones were not as pronounced as in the case of the siltstone cores. However, the presence of water at saturation levels clearly caused lubrication and reduction in effective stresses at the joints and weakening of the clay infillings as to have a contribution to the overall weakening of the intensely fractured rock masses.
(4) Intense Fracturing of the Rock Masses
The intense fracturing of the rock masses is visibly evident in the outcrops and the highly reduced sizes of the detrital materials in the slide. The use of Triple Tube Core Barrels (Mazier Sampler) was resorted to in order to reduce the disturbance effects of the sampling procedure.
The intense fracturing of the rocks in Cherry Hills and surrounding areas is probably due to its proximity to the Binangonan Fault identified in the MGB Report. Faulting and associated movements near this fault could have caused this intense fracturing, reducing effective sizes to within a range of 150mm to 300mm. In the borings conducted at site, Rock Quality Designation (RQD) values were seldom above 25% indicative of Highly Fractured Rock condition even in the areas not involved in the slide.
As a result of this intense fracturing, the rock masses would tend to behave more as soil like materials rather than as intact coherent masses.
This is corroborated by the Post Slide Geometry which clearly shows the shape of the sliding mass. Most prominent is the spoon shaped configuration that is typical of Rotational Slides in soils.
(5) Creep and Elastic Heave
Cherry Hills Subdivision was sited on a massive cut from the crest of a mountain slope. The cuts average about 20 meters plus, based on reconstruction of the terrain prior to the excavations (NAMRIA Map) and its reconciliation with the Site Development Plan by using GPS spot elevations.
Such large volumes removed (overburden relief) could induce elastic heave and subsequent creep on the remaining subgrade.
Particularly, because the rocks are intensely fractured, the large overburden relief resulted in removal of confining stress which could have allowed elastic heave in the rock.
This was further aggravated by the presence of creep in the general subdivision platform area.
That creep was taking place is strongly supported by reported cracking and disturbances in the residential units experienced even several months before the slide. Interviews with residents clearly indicated that cracking of walls of houses and observed difficulties in closing windows and doors have been occurring months before the landslide.
(6) Unfavorable 8º Dip to SW
The Bedrock stratification pattern as confirmed by MGB Geologists indicated an unfavorable 8º Dip to the SW, of the bedding planes of the sedimentary rocks (Sandstone and Siltstone).
The slide originated from the Eastern slope and nearly followed the general SW direction of the Dip of the bedding planes.
The highly unfavorable situation probably also induced creep on the subdivision platform bedrock. Due to this unfavorable Dip towards Cherry Hills, the platform rocks were subjected to compressional forces even well ahead of the main landslide event thus causing creep and the consequent problems experienced in some of the houses in the subdivision. The presence of impermeable siltstone bands also probably contributed to the increased heaving because of the buildup in pore pressure underneath these impermeable bands. This condition could further contribute to heaving and further destabilization in the critical hours before the landslide.
(7) Intervention by Man
Destabilization of the slopes in the Cherry hills area started soon after the large cuts made in the quarrying operations prior to subdivision development. The natural drainage pattern was altered. Loss of lateral support of the slope and the existence of a steep nearly vertical slope face removed the buttressing effect of surrounding ground making the slopes inherently weakened and for joints to open up. In addition, the natural gully at the back of the slope was suspected to have been filled up with spoils from the excavations which could have ponded water. However, this could not be verified. The large unsupported cuts allowed the fractures to further open up later on to allow destabilizing factors to come in.
7. CONCLUSIONS FROM THE INVESTIGATION
(1) General
In the three days, August 1, 2 & 3 immediately preceding the landslide of August 3, 1999, record rainfall levels were experienced with the highest level of 500 mm occurring on August 2, 1999.
With the record level of rainfall, development of near full Hydrostatic Pore Pressure was possible. The diversion or blocking of intermittent and continuous surface streams by the landslide movement can add surface water (which originally flowed elsewhere) to the groundwater in the slide area.
These combined with the intensely fractured rocks and already weakened rocks to initiate the landslide.
The confluence of these seemingly unrelated and unfortunate events was therefore responsible for the landslide. Prolonged water saturation and subsequent pore pressure buildup was the final blow that triggered the landslide.
As borne out by the foregoing studies and findings, no single factor could have exclusively caused this landslide and it had to take several events and factors (geologic, environmental, human) to meet, in the slopes of Cherry Hills, to cause the slide.
(2) Summary of Findings
The findings of the Committee are as follows:
Water saturation of the slope triggered the main slide although creep was already suspected to be occurring over time well before the main slide.
The slide that occurred at Cherry Hills on the night of 03 August 1999 was a compound slide made up of a slump and a rotational component.
The lateral and vertical deformation of several roadways near the NE quadrant of the subdivision was caused by a separate although associated mass slumping to the North.
The rotational component towards the East to West direction was the main slide mechanism although this could have been preceeded or currently with a minor shallow slide at the toe of the slope.
Corollary slides (Debris and Mudflow) occurred in the North and South gullies with the latter being more massive in terms of volume of earth and debris that were displaced.
Creep which was ongoing very much earlier than the slide, contributed to the weakening of the subdivision platform shallow layer causing it to fold beyond the toe of the main slide in accordion like fashion when the main slide occurred.
Not one, but several factors or influences coming together caused the landslide.
(3) Recommended Directions for Future Studies
The actual location of the slip plane needs to be further verified in addition to the limited Borings that were undertaken.
Seismic refraction equipment could be employed to map the subsurface and detect the stratigraphy and the shear zone in order to verify the conclusions made in this study.
REFERENCES
1) Wyllie, D. “Foundation on Rock”, page 64, 1st Ed Chapman Hall, London, 1992
2) Goodman, R.E. “Introduction to Rock Mechanics”, 2nd Ed., John Wiley & Sons, N.Y., N.Y. 1989, pp. 43 to 46.
EMILIO M. MORALES, MSCE 1] Chairman, PICE and ASEP Geotechnical Division
SYNOPSIS: A portion of the transverse Dike Spillway No. 3 was breached on August 3, 1996. The failure resulted in a break of about 67 meters of this Spillway, which is one of the 3 Spillways in the Transverse Dike of the Megadike System for the Pasig Potrero River. The Mega Dike System is an emergency dike designed to control the flow of Lahar into outlying towns and the capital city of San Fernando, Pampanga. Many theories and scholarly studies on the cause/s of failure have been brought forward as a consequence of this accident. This paper is a result of an investigation conducted by the author based on an ocular inspection of the site days after the incident, studies of photographs and field reports and conduct of various Engineering analyses in order to determine the probable cause of failure.
1.0 INTRODUCTION
Within a week after the breaching of Spillway No. 3 of the Transverse Dike in Pampanga, the author visited the site to investigate firsthand what caused the breaching from a Forensic Engineering point of view. Several other corroborating photographs were also obtained from various sources as well as data from various references.
This paper attempts to study the failure mechanism based on a broader study and engineering analyses in order to identify the specific and most likely cause of the breaching of the Spillway. No attempt has been made to pinpoint the blame on any person/s or entity. The results of the investigation are based on factual data and sound engineering principles.
In the investigation process undertaken, all possible failure mechanisms were studied resulting in the elimination of some, as not having contributed to the failure.
The study was a result of a long-term effort to gather information from various sources as well as the study of post failure evidence, mainly from engineering analyses, photographs of the relic structures and the debris. Engineering Calculations were performed to verify adequacy of the Transverse Dike structure as designed when subjected to the flood level encountered at failure.
2.0 BACKGROUND
The Transverse Dike system is a concrete faced embankment dike structure constructed perpendicular to the East and West Lateral Dikes of the Mega Dike System designed to control the flow of Lahar along the Pasig-Potrero River system.
The Mega Dike system, of which the Transverse Dike is a component, is an emergency structure to block the massive inflow of Lahar along the Pasig Potrero River estimated to be about 50M cu.m. The purpose of the Lateral Dikes is to prevent the spread of Lahar to the cities of Angeles and San Fernando and the towns of Bacolor, Guagua and Sto. Tomas.
The Transverse Dike system was designed to control massive flood flows and Lahar by creating a sedimentation basin formed by the East and West Lateral Dikes with the Transverse Dike serving as closure.
The Transverse Dike serves several purposes: ⦁ Contain Lahar sediments ⦁ Reduce the volume of water and Lahar flows downstream of the Transverse Dike ⦁ Reduce the velocity of flood waters
Three (3) Spillway Structures (Spillway 1, 2 & 3) were provided for the Transverse Dike of identical design. However, several contractors and subcontractors were involved at one time or another in the construction of the Spillways and the Transverse Dike in general.
(1) Technical Description of the Transverse Dike:
Length (East-West) – approx. 3 kms.
Base width – 41 meters
Crest width – 4 meters
Spillway height – 9 meters
Downstream Apron – 15 meters
The Upstream and Downstream faces were protected with an R.C. facing 150mm and 250mm thick respectively. The R.C. Apron is provided with a 2.6 meter and 1.0 meter concrete vertical face intended as a seepage barrier.
The Spillways were provided with 3 rows of Drain Pipes arranged in 7 columns. The original design called for steel pipes for all the 3 rows. However, during construction, the lowest row was substituted by large diameter R.C. Pipes. This decision became a critical factor in the investigation.
(2) The Spillway Failure Event
At around 1:00 p.m. of August 3, 1996, failure of the Dike System occurred. By 3:00 p.m. a 67 meter portion of the Transverse Dike had been washed out, totally, removing pipe columns 2, 3 & 4 and leaving column 1 on the West and columns 5, 6 & 7 to the East.
It was reported that the failure was preceded on August 1, 1996 by an earthquake of Magnitude 5.8. No damage was reported immediately after the earthquake or on August 2, 1996.
Eyewitness accounts immediately prior to the breaching of the Transverse Dike indicated that leaks started appearing in the concrete armor facing followed by sudden upward tilting of the pipes and progressive failure within 2 hours. A study of the site by the Author, and as recorded in photographs generally concurred with eyewitness accounts as R.C. pipes which were left, were tilted upward at the outlet end and downwards inside the dike core.
What caused the failure?
This paper seeks to unravel the mystery and in the process identify the failure mechanism based on investigation of all possible scenarios that could cause the failure or contribute to such failure.
(3) Investigative Study
This study got started almost within a week from the failure as the author visited the site to inspect the failure debris and study the remnant or relic structures that were left after the breaching. This included going inside the cavernous void inside the remnant of the dike where the pipes were located. Discussions at site during the inspection were made with various DPWH personnel as well as locals who were spectators to the incident.
Photos were also taken or obtained from various sources during the course of the investigation leading to this report.
As earlier indicated, the investigation covered all major possible cause/s for failure namely:
Design
Seepage
Piping
Slope Stability
Structural adequacy of Downstream RC Facing
Construction Details and Quality
Ocular Site inspection at time of incident
Inspection of RC Pipe Construction Details
Inspection of Dike RC Facing
Study of DPWH Plans
These were aided by information gathered, more particularly photographs, taken at the failure site after the breaching. These photographs served as important pieces of the puzzle in the Engineering Investigation and study conducted.
3.0 INVESTIGATION DESIGN
The investigation and Engineering analyses conducted were based on the plans and details of the spillway dike. The analyses procedures were done in accordance with standard engineering practice in the investigation of failures. In addition, parallel computational procedures were used whenever possible in order to check on the results, particularly in the very critical analysis of seepage effects.
The Engineering analyses were conducted on the following critical aspects of the Investigation of the design in the order of importance as relates to the Failure analysis:
⦁ Seepage Analysis using conventional Flownets and Finite Element analysis using SEEP2D Software. ⦁ Piping analysis by evaluation of the Critical Gradient ( icrit )and Average Gradient (iave ) at the Toe of the Dike Structure. ⦁ Slope Stability Analysis using SLOPE/W Finite Element Analysis software. ⦁ Structural Analysis of the RC Downstream Facing using STAAD Software.
All of the foregoing Computer Softwares used are universally accepted software commonly used by the Engineering profession. The results and input codes may be obtained from the author upon request.
(1) DESIGN PARAMETERS USED IN THE DESIGN INVESTIGATION
In the investigation of the design, the design parameters used were gathered independent of the design done by others. The parameters selected, particularly the soil properties used in the seepage analysis and Dike stability analysis were obtained from literature and various references.
As in any Failure investigation, the Analyses Parameters selected tended to be on the low side, in order to be conservative in the investigative results.
The table below summarizes the physical properties of materials used in this study.
To simplify the seepage analyses, the foundation material was considered to be fairly homogeneous down to the depth of interest for the seepage and stability analyses. Again, this would be on the conservative side as the density of underlying lahar sands at site were generally increasing with depth.
(2) SEEPAGE ANALYSIS
The seepage analyses were conducted using the universally accepted conventional Flownet Analysis2], which is a graphical presentation of flux or flow of a liquid or an electrical current in a field from a region of higher potential to a region of lower potential.
In turn, a 2D Finite Element Analysis using SEEP2D Seepage analysis software and its Graphical Pre and Post processor FASTSEEP were used to verify the results of the Flownet Analysis.
The figures below represent the Flownet and Finite Element computer analysis of the seepage condition at the time of failure when the floodwaters rose to 5.5 meters or about 3.5 meters from the Spillway Crest.
The above figures show striking similarity and agreement with each other and generally confirm correctness of the results of the two independent analytical procedures. The results clearly indicate that no detrimental seepage pressures could result from the floodwaters rising to 5.5 meters nor could harmful heave forces be generated underneath the base of the transverse Dike spillway structure.
A closer study of the flow diagrams in both figures show a hydrodynamic lag in the rise of the phreatic surface inside the Dike core as a result of the upstream concrete facing serving as an impermeable blanket or barrier. This was generally anticipated and the seepage analyses results show the positive effect of the upstream and downstream RC Facing or Blanket.
From this, it was also possible to calculate the resulting hydrostatic pressure on the downstream facing for analysis of its structural adequacy.
An analysis of the heave pressures developed at the base of the Spillway Dike, as the floodwaters rose, was also performed to determine whether heaving of the Dike core was likely.
The results of the calculations (included in Appendix “A”) indicate that the dike design would be adequate to sustain the seepage forces as well as heave at time of failure
(3) PIPING ANALYSIS
Piping is a physical phenomenon, which results in a “quick” condition; terms normally used to describe a “quick” condition are “sandboil” and “quicksand”.
Piping occurs when the buoyed unit weight of the soil γs’ is less than or equal to the seepage force acting in an upward direction. As a consequence, the effective stress becomes zero and the soil is floated and disaggregated resulting in a “liquefaction” effect.
Normally, piping occurs at the downstream toe of the Dike or Dike system when the exit gradient is relatively high and where the total weight of the soil column resisting the seepage force is at a minimum compared elsewhere in the Dike section. The piping then progresses inward to cause a tunneling effect, which can undermine the stability of a dike or a dam.
Piping can also occur within a dam base, particularly when the seepage velocity is relatively high or in the presence of highly permeable gravel formations as to carry fine particles downstream. However, and as verified from the SEEP2D analyses, the seepage velocities were very low due to the relatively low permeability of the Lahar sands (classified as Silty sand) and Borings did not indicate any gravel formation of any significance to the study.
At the critical liquefaction state, this condition is expressed in the following soil mechanics phase relations equation:
Thus, for this condition, the resulting gradient is defined as the critical Hydraulic Gradient icrit. From phase relationship of soils:
Therefore, substituting in equation (1):
Thus:
In the design of hydraulic structures, it is very important to ensure that the critical hydraulic gradient icrit is not reached through careful selection of materials (to obtain higher Specific gravity of the soil Gs and/or compaction in order to decrease the voids ratio e).
Using the foregoing assumed soil properties in Table 1.0 we determine the critical hydraulic gradient as:
Thus, the value of icrit: is greater than 1.0 and is thus acceptable. To further determine the factor of safety against piping it would be necessary to obtain the seepage forces acting upward against an element of soil at the downstream toe from the flownet of Fig. 1.0.
Between the equipotential drops ND=11 and ND=12, the heads are (see Appendix “”A”). N11 = 0.846m; N12 = 0.423m; The distance a-b is 7.0m (scaled)
Thus,
The hydraulic gradient acting upward against the soil element 7.0 meters wide is;
The factor of safety against piping is;
From the above, it can be shown that the Dike structure is safe against piping.
(4) STRUCTURAL INVESTIGATION OF D.S. RC FACING
The only other possible cause of the breaching from a Design point of view, is if the downstream armor facing failed due to hydrostatic pressure build-up inside the core as a result of rise in the phreatic surface. Such damage could allow fines to be washed out through the facing and thus internally collapse the dam. For the given flood condition, this can only occur at the bottom 3 meters of the downstream facing.
At the flood condition of 5.5m, the resulting phreatic table elevation at the back of the downstream facing is about 2.31m as computed from the SEEP2D Finite Element Analysis.
The downstream reinforced concrete facing is a 250mm thick concrete mat reinforced both ways by 12mm ø rebars at 300mm o.c. both ways.
In order to determine the force at the back of the downstream facing, the following condition was modeled using the portion of the RC Facing subjected to Hydrostatic pressure as a 5.27 meter square plate fixed or fully restrained at all edges or a plate that is pinned on all sides:
These two support conditions represent the upper and lower extremes insofar as support condition is concerned. The assumption of a 5.27m span is a very conservative assumption since probably a shorter slab span would be more realistic. The slab was analyzed as a flat plate acted on by a triangularly varying load. The condition of fully restrained (fixed) and Pinned conditions were used on a 5.27m square plate dimension.
Thus, it can be seen that even at the Pinned condition, the facing is only 20% overstressed and is very safe using a full Fixed condition.
The truly realistic condition would be somewhere in between these two support conditions that would render the facing safe for the flood condition, not to mention the very conservative large slab span assumed.
From the foregoing, we can conclude that the R.C. facing did not fail from the hydrostatic pressure developed inside the Dike Core.
(5) SLOPE STABILITY ANALYSIS
A two-dimensional slope stability analysis of the Dike core was performed using SLOPE/W, one of the more popular slope stability analyses program used worldwide by Geotechnical Engineers.
The results were obtained from analyses of the Dike stability both at failure condition (5.5m) and due to earthquake.
The slope stability analysis results indicated that the Dike is safe at static condition with a Factor of Safety (FS) equal to 1.279.
Earthquake loading was considered in the analysis corresponding to a 5.8 Magnitude Earthquake coincident with the flood level of 5.5M Flood as a purely academic exercise. The results show that the dike is marginally safe (FS=0.989) for combined earthquake and flood level of 5.5 meters, which is an unlikely combination.
(6) HEAVE ANALYSIS
From the Flownet analysis, the equipotential lines intersecting the base of the dike are converted to upward pressure. This pressure tends to heave the dike and is only counteracted by the weight of the Dike Structure.
The analysis and results are shown below: Wd = Weight of Dike = 873.66 kips PSP Total upward Force at Base = 297.7 kips
(7) SUMMARY OF FINDINGS IN THE INVESTIGATION OF THE DIKE DESIGN
From the foregoing, we can summarize the findings resulting from the investigation of the Design as follows:
Seepage Analysis – Safe F.S. against Piping – 11.32 very adequate F.S. against Heave – 2.93
Dike Stability (Slope Stability) F.S. Static Condition – 1.279 adequate F.S. Seismic Condition – 0.989 OK (see Discussion)
Slope R.C. Facing DS R.C. Facing Slab structurally adequate against buildup of hydrostatic pressure for Flood level Failure.
Thus, it can be concluded that the Dike design was adequate for the Conditions at the time of failure.
4.0 INVESTIGATION OF CONSTRUCTION DETAILS
The author considers that the best way to present the bases for this portion of the investigation is to present these in photographs taken after the failure, coupled with corresponding observations and commentaries of the author based on his ocular inspection at site and reviews of various reports.
From these, and by elimination, conclusions can be formed as to whether any of the feature/s have contributed or not to the Failure in the same way that the Investigation of the design was carried out in the first part of this paper.
(1) BACKGROUND
The original construction called for the installation of 3 rows of relief pipes in 7 columns for each of the 3 Spillways.
These relief pipes were designed to allow water and lahar in suspension to be drained to reduce buildup of hydrostatic pressure at the upstream side during normal flows. Eventually each layer of pipe will be naturally deactivated by the buildup of sediment at the upstream side, effectively blocking the flow. These pipes were originally specified to be all steel pipes.
Sometime during construction, a field change was made by substituting large diameter R.C. Pipes at the bottom row for the steel pipes originally specified as the specified diameter steel pipes were not readily available in the market. This change was implemented in the final construction.
Prior to the failure, it was reported that all the R.C. pipes in the lowermost row stopped flowing. Eyewitness accounts gathered from various reports indicated that although at the downstream end the flow was completely stopped, there was rapid intake forming a whirlpool at the upstream pipe intake, followed by cracking of the downstream R.C. Facing and seepage coming out through the cracks and eventually by massive collapse.
Photographs taken at the site corroborate these observations.
The picture below shows what remained of the spillway after a 67 meter section was breached. A closer look at this photo, looking West, shows that the Dike core was internally eroded with the Downstream and upstream armor RC facing collapsing into the core.
The subsequent photos will explain why and how this happened.
(2) R.C. PIPES
The R.C. Pipes are 900 mm Ø x 1.0 meter long. These were designed to be bedded or laid on a Reinforced Concrete Bedding in turn resting on a well compacted subgrade composed of dike core materials shown in the revised project plans and sketched here below as Fig. 8.0.
The detail above shows that the bedding concrete is to be reinforced by 2-16 mm Longitudinal rebars and 12 mm transverse ties at 200 mm on centers.
Also, the dimensions of the pipe Mortar Grout are shown to be 200 mm wide and 100 mm thick tapering at the ends.
The subsequent photographs show critical deviations from the above requirements as contained in the plans as follows:
Photo No 1 clearly shows the absence of rebars on the bedding concrete. The bedding has completely sheared off at the joint allowing massive inflows inside the Dike Core creating the massive caverns shown in the subsequent photos. Note that the mortar grout had been removed at one side.
Photo No 2 also shows the same absence of rebars in the supposed to be reinforced Concrete bedding. As can be noted, most of the pipe breakages were at the critical pipe joints where the pipe is weakest. However, total collapse and full breakage of the pipe joints could have been prevented or minimized if the concrete bedding reinforcement had been placed in accordance with the plans and details…………………
Photo No 3 shows that the Mortar grout that was placed when compared to the scale of the pipe indicates that the mortar grout dimensions specified in the plans were not followed. Also, note that the thickness of the Mortar grout at the top of the pipe is very much different only at a short distance away from the top along the sides. Why this is so is not clear to this investigator.
These photographs (Nos 4 & 5) show the poor quality of the mortar grout. Note the gap that was neatly debonded from the pipe body in Photo No 4. Although not clearly discernible in this photo, the mortar grout is relatively less than the 100 mm thickness specified in the plans.
Photo No 5 more clearly illustrates the quality of the Mortar grout as laid and its actual thickness.
This photo No 6 shows the pipes tilted upward as it daylights at the outlet end downstream. The armor facing has collapsed inward. Also to be noted in this photo is the cavity formed underneath the facing and alongside the pipes.
The pipe tilted inward indicates that internal collapse occurred rather than an outward failure that could have been caused by excessive build-up of pressure inside the dike core otherwise, the pipes could have been pushed downward and out.
This clearly suggests that undermining from internal erosion caused by Internal leaks along the pipe joints was the most probable cause. These leaks which became critical as the leaks progressively got bigger eventually led to the critical breakage of the unreinforced concrete bedding at the pipe joints causing massive pressurized flows inside the dike core.
This photo No 7 shows the pipes also tilted upward at the outlet end downstream as in previous photo No 5. The pipe inside also shows undermining of support more clearly visible in the previous Photos ( Photo No 3 & 6) above.
Note the cavity in the background (Inset “a”) and the location of the rebar of the armor facing relative to the facing thickness. Inset “b” also again shows the absence of rebars in a remnant of the bedding concrete that is still partially attached to the RC pipe.
All of the foregoing photographs show significant deviation from the plans and/or good construction practice in three critical requirements:
Lack of longitudinal and transverse reinforcing bars for the RC Bedding.
Inadequately sized mortar joint details
Poor Quality of Construction
The foregoing deviations clearly have a significant role to play in the failure that ensued. It is only a matter of tying the pieces together to establish the Failure mechanism that caused the breaching of the Spillway No 3 of the Transverse Dike.
(3) DOWNSTREAM RC ARMOR FACING
The second element of the dike to be investigated was the Reinforced concrete armor Facing at the downstream side.
The plans and details of the transverse Spillway Dike called for a 250 mm thick RC Facing reinforced by 12 mm rebars at 300 mm on centers both ways. The details show that the rebars are to be placed at the middle of the RC Facing thickness.
The following photographs show evidence that the rebar placement was different from that specified in the plans.
Photo No 8 show the rebars as laid out in the actual construction. The rebars are all at the bottom or nearly at the bottom of the RC Facing where it is ineffective in resisting lateral forces from internal water pressure. Our structural analyses indicated ( See section 4 pages 5-6 ) that if the rebars have been correctly placed in the middle, the facing slab would have been adequate to sustain the lateral pressure buildup due to the rise in the phreatic surface inside the dike core. No analysis is required to show that the facing concrete would fail once the tensile capacity of the Concrete (which is very minimal) is reached. This explains the disintegration of the concrete facing as can be seen in Photo A.
This photo shows the rebars debonded from the RC Facing . The picture also show that the rebars were not placed in the middle of the Facing but rather at the bottom portion of the slab where it is ineffective in “reinforcing” the concrete facing.
The wrong placement of rebars is also seen clearly in Photo No 7.
(4) SUMMARY OF FINDINGS ON CONSTRUCTION DETAILS
The foregoing photographs (Photo 1 to 9) established the following major deviations from the plans:
The Mortar grout dimensions and quality did not comply with the plans and standards of construction.
The RC Bedding did not have any reinforcement at all.
The RC Facing at the downstream side of the dike had the rebars laid at the bottom of very near bottom of the Facing slab where it was ineffective in resisting outward pressures from the build-up in the phreatic surface within the core of the dike.
These significant departures from the plans and quality standards have a role to play in the Failure mechanism that could be pieced together from the failure event as well as the study of the remnant or relic structures and failure debris.
Taken individually, the following are the contributions to the Failure mechanism:
The inadequate mortar grouts allowed leaks at the joints causing progressive erosion and cavitations within the Dike core.
The unreinforced pipe bedding gave way by completely shearing at the joint as the subgrade support is eroded by leaks. This in turn caused a major pipe breakage stopping the flow completely at the outfall end (as observed by eyewitnesses immediately prior to failure) and discharging the full pipe flow within the dike core. This in turn increased the hydrostatic head within the dike core to the available head at the upstream (5.5 m). The pressure build-up induced lateral pressure on the RC Facing. The pipe breakage caused the full discharge of the pipes under a 5.5 m head to internally erode the dike core causing further breakages in other pipes and forming huge cavities inside.
The wrong placement of the rebars (Nearly at the Bottom of Facing ) gave the facing very minimal flexural resistance against the outward lateral pressure build-up causing failure of the concrete in tension and in places completely debonding the reinforcement from the concrete slab. This explains the breakup of the facing into small slab panels as shown below ( see also Photo “A” ):
It is possible, although there is no proof to substantiate this, that the Earthquake of August 1, 1996 caused the initial dislodgement of the RC pipes or debonding of the poorly constructed joints as to trigger the initial leakage which became a massive flow when the pipes sheared at the joints.
However, even without such disturbance, leaks are likely to occur in the poorly constructed joints and weak bedding support, that could lead to similar failures as has occurred.
Thus, the likely failure mechanism is as described above. This is supported in turn by several other observations as described below:
The RC pipes at the outfall ends were tilted upward suggesting internal collapse.
The RC Facing slabs have dished in inward suggesting internal collapse of the Dike core.
4.0 CONCLUSIONS
The results of the Engineering investigation as supported by engineering analyses and calculations, indicate that the Transverse Dike Spillway design was adequate for the conditions encountered at failure and that no detrimental seepage condition could likely form as to cause failure. The possibility of collapse due to Piping also can be ruled out. The Engineering analysis of the piping at the downstream end indicates that the critical Gradient is adequate and cannot be overcome by the upward seepage gradient.
The same cannot be said of the construction details as uncovered during this investigation from ocular observations done by the author, from photographs taken after the failure and from corroborative eyewitness accounts as documented in various reports.
The Transverse dike failure can only be directly attributed to internal erosion within the dike core, which could have only been caused, initially by a leak or leaks in the pipe joints followed by massive discharge after the leaks have undermined the pipe supports, causing the pipes to fail at the joints. This conclusion is backed up by corroborative description of what happened immediately before the failure as contained in various investigation reports and also by the photographs contained in this paper.
5.0 LESSONS LEARNED
The engineering profession and the Construction Industry can learn a lot from such investigations of failures. It allows us to look back at our mistakes so that they would not be repeated in the future. In addition careful attention to seemingly unimportant details in normal construction become critically important when used for other more critical structures.
Clear departure from the plans by the omission of rebars in the bedding concrete could have been easily detected during construction, with adequate quality control and supervision.
A case in point is the mortar grout for RC Pipes. Whereas minor leaks do not become evident or are tolerable in drainage pipes which are normally not flowing full or not under full head, such leaks within a 9.0- meter earthen dike embankment could really be disastrous as proven by this incident.
The absence of care in the laying of the reinforcement for RC Facing, clearly evident in this incident, should not have happened with proper care and adequate superintendence.
1] Emilio M. Morales MSCE – Master of Science in Civil Engineering, Carnegie Mellon University, Pittsburgh, PA, USA, Doctoral Student, Asian Institute of Technology, Chairman, PICE and ASEP Geotechnical Committees, Principal EM2A Partners & Co., Formerly Senior lecturer in Soil Mechanics and Foundation Engineering, Graduate Division, School of Civil Engineering, University of the Philippines, Chairman joint PICE/ASEP investigation team for Cherry Hills Landslide.
2] A 2D Finite Element Seepage Computer program developed at Brigham Young University, Provo, UTAH.
The design of girder to column joints have evolved over the years but essentially done by following standard prequalified details such as the ones published in the ASEP Guide 1991 3 for standard Butt-welded Beam/Girder to Column Joints. This joint is now known universally as the “Type 1 Joint” in contrast to other joint types, which have been proposed to replace it.
But why was there a need to replace this Joint detail as proposed by respected US Technological Associations involved in Earthquake Engineering and Research even as early as 1994? Also, why does this detail keep on recurring in Building designs here in our country?
These questions and the reasons why this Type 1 joint should be replaced is the topic of this Paper. It is hoped that the Local Engineering profession or some fellow practitioners who are not aware of the problem associated with this detail would be able to understand the compelling need to change their details. In addition, it is hoped that ASEP would take the lead and issue a circular “outlawing” this joint for use in seismic detailing and withdraw this detail in the outdated 1991 Guide.
1.0 Introduction
As soon as the findings of the Northridge Earthquake of 1994 became common knowledge in the Engineering community both locally and abroad, serious questions have arose regarding the highly critical vulnerability of the Traditional Type 1 or the Butt-welded Beam/Girder to Column Joint in structural Steel construction. It was found out that significant failures occurred in localized regions of the joint and column flanges, which required very costly repairs. As a result, some buildings in California that otherwise appeared safe (At least in external appearance), had to be razed because of the uneconomic cost of repairs entailed by damage sustained by this Type 1 joint.
This Joint Type is illustrated below in 3D rendering taken from Ref 6] and shows the connection detail where the Beam or Girder Flanges and the web are butt-welded to the column Flange. The Column may or may not be reinforced with web stiffeners.
(a) Type 1 “traditional” moment connection
Consultants who kept abreast of the State-of- Practice quickly abandoned this detail and adopted the Official recommendations published by various research organizations such as the SAC Committee 4
However, and surprisingly as we have observed in the local Engineering community, some design houses were still very slow to adopt or have continued the use of the highly vulnerable Traditional Type 1 joint detail despite almost 10 years since this joint was removed from the recommended details.
Why this poor state of affairs? Partially this is to be blamed on the lack of knowledge and information on developments in the structural engineering field due to lack of funds for keeping abreast of the state-of practice and/or lack of interest. Also, this could be partly because the ASEP 5] has not superseded the 1991 Guide which contained this originally “recommended” but otherwise banned Traditional Type 1 joint detail.
However, both these two situations are not acceptable excuses particularly nowadays because of the easy access to FREE technical information from the Internet where most of the materials in this Paper have been obtained.
This problem, which prompted the writing of this paper, became glaringly evident when our office was asked recently to do a value engineering study for a 5-Storey structural steel commercial building, which was already in the bidding pipeline.
Aside from our findings that the building was over designed by as much as 30 to 40% for the primary structural framing system, ironically, failure could still ensue despite the over design due to the highly vulnerable Traditional Type 1 joint detail provided in the plans. To compound the problem, the building was long but narrow in plan and required a column free interior. This resulted in dependence on only two column rows leaving no alternative stress paths. Thus a domino type collapse is possible with a failure in one of the joints as the girder spans are relatively large at 15 meters.
1.1 The ASEP Guide “ Earthquake Resistant Design of Structures” 1991 Edition 6]
The ASEP Guide “ Earthquake Resistant Design of Structures” 1991 Edition contained in Chapter 4 “Recommended Structural Detailing Practices” the Traditional Type 1 joint detail as connection Detail 4.29 on page 182.
In addition, page 178 of the same Guide required a Column to Girder Strength Ratio of 1.25. While this requirement could promote a “Weak Beam Strong Column” (WBSC) approach espoused in later studies, this pre-Northridge Earthquake” provision was not enough to prevent damage to this Type of Joint.
It should be noted that the ASEP Guide was published as the 1991 Edition. The Northridge Earthquake occurred in 1994 or 3 years after this publication. Our recent telephone inquiry with the ASEP Secretariat 7] indicated that this Edition has not been superseded by later publications.
The following detail was lifted from the ASEP Guide 4]
Type 1 Joint in ASEP Guide
2.0 Historical Background
The Northridge earthquake resulted in 57 deaths, more than 5,000 injured and $20 billion in property damages, making it the costliest seismic disaster in U.S. history. Severe structural damage was seen in a wide variety of buildings. The engineering community was specially surprised by the poor performance of the highly regarded and widely used beam-to-column welded connections of Steel Moment Resisting Frames (SMRF).
After the Earthquake of January 17, 1994, a task committee was formed in the USA consisting of the Structural Engineers Association of California (SEAOC), the Applied Technology Council and the California Universities for Research in Earthquake Engineering (CUREE)). Collectively known as the SAC Joint venture Ref 7]. The SAC studied Post earthquake damage effects. A very disturbing or even alarming consequence is the discovery of numerous damages in beam to column Joint connections, which were based on what is now known as the “Traditional Type 1 Connection” for Moment framed joints.
Excerpts from the report are collected herein to shed more light on the criticality of this type of joint.
“Prevailing construction design codes take into account a strong inelastic behavior by the steel structure when exposed to earthquake ground motion. This is why ductile elements and connections are used in the SMRF. Based on research dating back to the 1960’s and previous earthquake experiences the steel frame with moment resisting connections has been considered the most reliable seismic resistance design for low and high-rise buildings. The common usage of welded steel moment resisting frame is also a consequence of its versatility, economy, and its supposed high plastic deformation capacity.
In just 15 seconds, the Northridge Earthquake invalidated historic design approaches and proved wrong the theory of integral ductile response of the welded SMRF. In more than 250 buildings, brittle fractures were discovered in the welded beam-to- column joints. Fortunately not a single building collapsed and no death or injury occurred due to the unexpected mode of failure. The cracks were observed through the beam-to-column welds and/or through the base metal of the beam or column flanges. These cracks resulted in a loss of seismic moment resistance in the damaged connections; however, the connections still transferred gravity loads which may explain why there were no total collapses triggered by the brittle failure of welded joints.”
The Northridge earthquake caused an unexpected brittle failure on welded SMRF constructed conforming to modern building codes and standards of practice. It was proved that those welded SMRF connections did not fulfill the design intent of providing reliability and safety. Research was initiated to improve these connections.
(“The Northridge Earthquake and Welded SMRF “) Anon 3].
3.0 Girder to Column Moment Joint Details
3.1 Traditional Girder Column Joint Detail
The Figures below, taken from Ref 6] show the various components of the typical “Type 1” Pre Northridge Earthquake Traditional Type 1 Joint connection detail.
Figure 2-1 Elements of Welded Steel Moment Frame
The foregoing is the same detail incorporated in the ASEP Guide “Earthquake Resistant Design of Structures 1991 Ed” unfortunately; this guide has not been replaced nor superseded to reflect the current State of knowledge regarding the problems associated with this connection detail in the light of the Northridge Earthquake experience.
The failures are primarily attributed to a fundamental flaw in the standard code- prescribed welded-flange bolted-web connection and the extreme ground motion at the site. 8]
As would be evident in this report, this type of detail would no longer be acceptable based on current state of practice due to the inherent lack of ductility and propensity for localized failure in the joint panel based on numerous recorded failures of this Type of Joint.
Below is a Detail from a drawing for the 5 Storey Commercial building, which was the subject of the Value Engineering we conducted:
Based on the details as shown above, taken from a scan of the drawings, the following are main features of the Joint detail:
A plug weld is used to weld the Girder flanges supported by a backing bar or spacer directly to the column flanges.
Connection plates (“Stiffener”) at the level of the top and bottom flanges were incorporated within the joint panel as stiffener plates.
The girder web is connected to the column by means of connector plates butt welded to the column using a Vee weld.
The foregoing figure shows that the joint connection details are similar to or identical to joint connection details in use prior to the Northridge Earthquake, which consists essentially of Girders being framed into columns by full welding of the Girder Flanges to the corresponding column Flanges or webs by butt or groove welds. These welds were very much in use pre 1994 until detailed post Northridge Earthquake damage evaluation indicated that something was terribly wrong with these joints.
3.2 Type 1 Joint Failure Mechanism
Simply stated, the problem with the traditional Type 1 Connection is the lack of Ductility in the Panel Joint connection details leading to brittle fractures. However, the crack initiation and propagation mechanism is not as simple. In all cases where the Type 1 joint was examined, failure was at the region of the connection between the top and/or bottom Girder flange/s and the column.
Failure was initiated in all instances by the incomplete fusion flaw as provided by the backing bar and its gap to the column flange. This constitutes a pseudo crack, which becomes a stress raiser during cyclic loading leading to crack initiation.
The open notch tip of the weldment where the backing bar is placed simulates a crack in itself. During cyclic dynamic loading, the crack propagates into the weld metal into the Heat affected zones (HAZ) and unaffected zones.
Figure 4. Brittle failure in “traditional” steel frame connection observed after Northridge EarthquakeDamage to Column Very Severe
Researchers have found that the stresses induced in the process although highly localized, are at least one order of magnitude higher than the stresses predicted by elastic analyses. These highly localized overstresses are concentrated at the Girder bottom flange connection within the critical joint panel connection.
This is compounded by the problem that this portion of the joint is the least accessible under field welding conditions thus; the quality of workmanship becomes an issue. This is highly undesirable, as we would not want the failure to initiate at the column or at the critical joint Panel connection as both would exhibit brittle failure modes.
It would be necessary to shift any failure to the connecting Girder (or Beam) away from the Joint. This would ensure that plastic hinging would occur at the Girder to allow flexural yielding rather than a brittle type of Failure. This is the basis for the recommendation Ref 9] to have a “weak beam strong column concept” (WBSC) in order to assure that the failure is not brittle. Providing a weaker beam (relative to column strength) assures that the failure would be that of plastic hinging of the beam, which ensures the extended ductility of the system. Formation of plastic hinges in the beam promotes a “beam sway mode” Failure mechanism, which is preferred over “column hinging”, which could result in more catastrophic collapse modes.
The AISC “Seismic Provisions for Structural Steel Buildings of 1997” Ref 9] for intermediate and special moment frames has adopted the position that:
“For Fully Restrained Connections, yielding must take place in the members of the frame (plastic hinge in beam, panel zone, etc.) and not in the connections.
However, since yielding in the column is the least desirable result, the design engineer should consider designing the system such that flexural yielding occurs in the beam. For FR connections that are part of ordinary moment frames, the connecting elements may yield as long as 0.01 radians of plastic rotation can be provided by the system”
A study of the resulting stresses and strains under repeated cyclic loading of a Type 1 Joint was made as part of the study reported in Ref 6] (See Appendix). The color contour indicate the severe stress and strain concentrations at the Girder flange to column Flange intersections.
The study concluded that:
“The traditional (Type 1) moment connection experienced high-order bi- directional localized plastic strain at the weld root at critical junctures between the girder and column, which is one of the causes of premature brittle fracture. The strain patterns shown in Figure 16 clearly indicate the propensity for this phenomenon. The strain gradient is particularly pronounced at the mid plane of the girder near the weld and weld access hole.”
The study further revealed that:
“Yield stress near the weld access hole and flange weld is exceeded early on in the loading. The strain plots near the weld access hole and flange weld show the stress reversal in the free edge of the girder flange, which is typical for traditional moment connections and a causative factor in fractures initiated from this region of the flange weld. This can potentially lead to fractures either in the flange or, far more critically from the progressive failure perspective, in the column flange. It is primarily this mode of failure that effected moment connection damage in the Northridge earthquake.“
Type 1 Connection Showing Von Mises Stress Contours
3.3 Post Northridge Earthquake Damage Assessment Studies
From these studies it was clearly evident that the “Traditional” Type 1 pre Northridge connection details normally used and espoused by various authorities of that time have failed miserably and at joint locations that are not necessarily the worst stressed member based on post damage reanalysis of the buildings.
In the research done by Mahin S. Ref 3], from the University of California at Berkeley, we quote his findings:
“Comparisons of damage survey data with results of elastic analyses of the buildings (using recorded and simulated Northridge earthquake records developed for the building sites [5]) show relatively poor correlation.
Analyses suggest that the most heavily stressed joints are most likely to be damaged; however, the precise location and severity of damage was notreliably predicted by conventional elastic dynamic analyses. The 60% most highly stressed connections in a structure (relative to their capacities) have roughly equal chance of being damaged. Areas of low computed stress were also subject to damage. Thus, analysis may not be a good way of assessing the particular joints to inspect, though it may indicate floors that should be inspected. The reasons for differences between observed and computed behavior include the effects of initial defects and poor workmanship, and the limitations of current analytical methods and models. For instance, inclusion of slabs and panel zones had an important effect.
Most design calculations are based on an assumption that plane sections remain plane during deformation. However, review of experimental data and results of finite element analyses suggest that this is far from true, with high local bending and shear deformations being induced in beam and column flanges. This is especially pronounced when plastic shearing deformations occur in the panel zone. Results demonstrated that these panel zone deformations were often very large. In such cases, the distribution of shear stress over the depth of the beam’s web is not uniform, often concentrating the majority of the shear force in the highly stressed beam flanges. Compounding this situation is the fact that actual material properties are not uniform, and vary randomly from member to member and systematically with loading direction, section size, and welding procedures. Normal member-to-member variation of material properties may result in members stronger than the connecting weld, or a column that is weaker than the supported beam. As a result, the joint may have negligible inelastic deformation capacity, regardless of workmanship.” (Mahin) Ref 3]
In just 15 seconds, the Northridge Earthquake invalidated historic design approaches and proved wrong the theory of integral ductile re
The Northridge earthquake caused an unexpected brittle failure on welded SMRF constructed conforming to modern building codes and standards of practice. It was proved that those welded SMRF connections did not fulfill the design intent of providing reliability and safety. Research was initiated to improve these connections.
(“The Northridge Earthquake and Welded SMRF “) Anon 3].
3.4 The Northridge Earthquake and Damage to Beam Column Connections
The figure below shows the various types of damage to Joint Panel Connections sustained during the Northridge Earthquake sustained by the Traditional Type 1 Joint Detail after Youssef. (The numbered arrows point to the Cracks)
4.0 Conclusions
Researchers and research establishments in the United States have evaluated several candidate replacement Joint details. Full- scale load tests under cyclic loading were also conducted to determine the response of the various joint details to cyclic loading.
As a result, pre tested details have been evolved and included in the recommendations. Of this, the Type 3 joint shown subsequently has been recommended in addition to other proprietary and nonproprietary joint details.
It is suggested that Engineers who have not done so yet, consider abandoning the Type 1 Joint in favor of the Type 3 Joint in order to correct the potential problems associated with the former.
There are now available prequalified joint details, which could replace the Type 1 Joint. Tests conducted on these alternative details to replace the Type 1 connection have been made and are available in current literature Bjorhovde R. Ref 5] and Houghton ref 6].
Several details have become prequalified as replacement for Type 1 Joints in new construction.
The primary objective is to promote the “weak beam strong column” (WBSC) concept. This is to ensure that initial yielding will initiate at the girder a distance from the Joint and not at the more vulnerable column panel where failure would be in the brittle rather than ductile mode.
Bjorhovde R. Ref 5] made tests on such prototype joints and of these, the so-called “Type 3 Joint” performed very well. For the Type 3 connections it was decided to place the continuity plates with the outside edge in line with the beam flange to cover plate interface. Figure 4 shows the details of the Revised Type 3 connection. Bjorhovde R. Ref 5]
4.1 Cover Plate Connections
Thus, it can be seen that the introduction of cover plates, which has the effect of making the joint strong where it is coverplated, transfers the stresses to the weaker beam section beyond the joint coverplate initiating a more ductile failure mode.
4.2 Conclusions in the Study by Bjorhovde Ref 5]
“The tests of the “Type 3” connections demonstrated excellent plastic rotation and energy absorption capacities. It was also found that although cracks developed and eventually propagated through the column material, the propagation was slow and stable, with numerous crack arrests during the testing. Such was also the case for the cracks that propagated into the column k- area, demonstrating that a crack in this region will propagate in stable fashion, given appropriate connection details and fracture paths. Further, these connections used thinner cover plates and fillet welded and repositioned continuity plates. Finally, the cropping of the 413 continuity plates is important, to the effect that the ends of the welds need to be kept away from the k-area, but this observation applies to all kinds of welds and connections. In brief, fabrication and construction economies will be obtained with the Revised Type 3 connection.” Bjorhovde
4.3 Recommendation of the SAC Panel
The SAC Joint Committee Ref 7] have issued recommendations for Post Northridge Earthquake Building Construction contained in “Interim Guidelines: Evaluation, Repair, Modification and Design of Steel Moment Frames 3]
“The building code provisions for earthquake resistive design of Special Moment-Resisting Frames (SMRFs) assume that these structures are extremely ductile and therefore are capable of large plastic rotations at, or near to, their beam-column connections. Based on limited research, and observations of damage experienced in the Northridge Earthquake, it appears that conventionally designed connection assemblies configured such that plastic deformation concentrates at the beam- column connection(referring to Type 1 Joints) are not capable of reliably withstanding large plastic rotation demands. The reliability appears to decrease as the size of the connected member’s increases. Other factors affecting this reliability appear to include the quality of workmanship, joint detailing, and toughness of the base and weld metals, relative strengths of the connection elements, the combined stresses present on these elements.
Unfortunately, the quantitative relationship between these factors and connection reliability is not well defined at this time. In order to attain frames that can reliably perform in a ductile manner, these Interim Guidelines recommend that SMRF connections be configured with sufficient strength so that plastic hinges occur within the beam span and away from the face of the column. All elements of the frame, and the connection itself, should be designed with adequate strength to develop these plastic hinges. The resulting connection assemblies are somewhat complex and the factors limiting their behavior not always evident. Therefore, qualification of connection designs through prototype testing, or by reference to tests of similar connection configurations is recommended.
These procedures should also be applied to the design of Ordinary Moment-Resisting Frames (OMRFs) located in zones of higher seismicity, or for which highly reliable earthquake performance is desired, unless it can be demonstrated that the connections can resist the actual demands from a design earthquake and remain elastic. Interim Guidelines for determining if a design meets this condition are provided. Light, single-story, frame structures, the design of which is predominated by wind loads, have performed well in past earthquakes and may continue to be designed using conventional approaches, regardless of the seismic zone they are located in. Materials and workmanship are critical to frame behavior and careful specification and control of these factors is essential.
Other joint details such as the intentionally weakened beam with holes in the web, and the Reduced Beam Section (RBS), “The Dog Bone” and proprietary technologies such as the “SidePlate™ “ represent the other end of the spectrum. Houghton ref 6]
The RBS or “Reduced Beam Section” also known as the “Dog Bone” because of its shape introduces a weakening at the Beam or girder to allow it to fail in ductile mode ahead of the column.
The “SidePlate™ “ is a patented proprietary technology. The intention is to strengthen the Panel Joint with “SidePlate™ “ for the purpose of strengthening the joint and the column at the critical panel point.
Tests have shown that even with the failure of one column such as in a bomb blast, the Building will not collapse. Thus, this patented joint is now being used in construction of new US Federal Buildings.
The SAC Joint Committee also evaluated several other details one of which is the induced Plastic Hinge at the web a distance from the stiffened Girder Column joint as shown below SAC Joint Committee ref 7]:
If dead loads are not very significant, then the plastic hinges can be induced at D/3 from the end of the reinforced section. However, if gravity loads are significant then a plastic design and analysis should be undertaken to determine the actual location of plastic hinging.
5.0 Closure
It is evident from the foregoing that the Traditional Type 1 Joint Detail should not be used in Structural Details anymore and that there is a need to update, supersede, amend or rescind the details given in the ASEP Guide of 1991 pertaining to this joint detail.
For Questions or Queries: emmorales02@yahoo.com
Table of references
Task committee report SAC Joint venture “Interim Guidelines: Evaluation, Repair, Modification and Design of Steel Moment Frames”
ASEP Guide “Earthquake Resistant Design of Structures” 1991 Edition
Stephen A. Mahin. “Lessons from Steel Buildings Damaged by the Northridge Earthquake”. Department of Civil and Environmental Engineering, University of California, Berkeley
National Science Foundation- Failure Analysis of Welded Steel Moment Frames Damaged in the Northridge Earthquake NISTIR 5944
Bjorhovde R. “Influence of Column Straightening Protocol on Connection Performance”. The Bjorhovde Group, Tucson, Arizona, U S A
Houghton D. et al “Post 9-11 Multi-Hazard Mitigation in Steel Frame Structures as a Function of Connection Geometry”. 71st Annual Convention of the Structural Engineers Association of California, Santa Barbara, California. September 26-28, 2002
SAC Joint Committee Interim Guidelines: Evaluation, Repair, Modification and Design of Steel Moment Frames”.
Federal Emergency Management Agency (2000). FEMA 350 “Recommended Seismic Design Criteria for New Steel Moment-Frame Buildings”.
American Institute of Steel Construction, Inc. (1997). “Seismic Provisions for Structural Steel Buildings”.
Bruneau, M. and Uang, C-M (1998). “Ductile Design of Structures”, McGraw-Hill, New York, New York.
1Master of Science in Civil Engineering major in Geotechnics and Structures, Carnegie Mellon University, Pittsburgh Pa. Chairman PICE Geotechnical Division, Former Senior Lecturer Graduate Division, School of Civil Engineering, UP Diliman.
2Master of Science in Geoengineering, major in Geotechnical Earthquake Engineering, University of California – Berkeley, CA. Member of the faculty, Mapua Institute of Technology CE Department.
3 ASEP Guide “Earthquake Resistant Design of Structures”
4 Task Committee composed of the Structural Engineers Association of California (SEAOC), the Applied Technology Council (ATC) and the California Universities for Research in Earthquake Engineering (CUREE) ). Collectively known as the SAC Joint venture. 5 Association of Structural Engineers of the Philippines
6 ASEP Guide “Earthquake Resistant Design of Structures.” 1991 Edition 7 Telephone Inquiry June 10, 2005
Emilio M. Morales MSCE EM2A Partners & Co Quezon City, MM (Philippines)
Toshio Ono MMLRT Consultants Tokyo, Japan
ABSTRACT
A support Pier (Pier 161) for a Light Rail line being constructed for the Metro Manila Light Rail Project encountered large settlements after the installation of the Precast Deck Girders. This pier supports bridge crossing across the San Juan River with a total span of sixty (60) meters. This Pier is supported on six (6) 1500 mm diameter bored piles designed to extend down to 17 meters or socketed into bedrock at least 2.0 meters based on design requirements. The structure started to settle during the erection of the superstructure when the dead load reached about 700 metric tons. Total settlement was about 42 mm when the erection was halted at a dead load of about 1600 metric tons.
The pier was designed to carry a maximum total load of about 2100 metric tons (DL + LL). Subsequent subsurface investigation conducted by our office indicated that the bored piles were terminated prematurely and were not socketed into bedrock as originally specified. The Bored pile tips were resting on approximately 150 mm of soft to very soft clay and highly weathered bedrock, which is partly natural soil and drill cuttings. Several remediation procedures were considered but finally, Jet grouting was selected .
This paper discusses the problems associated with the settlement and the ensuing solution using Jet Grouted Piles.
INTRODUCTION
The subsurface soils, being natural deposits, tend to introduce unexpected variability in the subsoil that is not revealed by the soil exploration or during construction. This situation could lead to costly delays in the process. In addition, errors in construction of foundations could lead to serious problems that would require costly intervention.
This paper addresses the foregoing real world problems, which have been solved with the use of innovative foundation technologies.
SETTLEMENT OF BORED PILE FOUNDATIONS
A pier supporting 60 m long span Precast concrete Box Girders for a light rail transit line crossing a river experienced significant settlement immediately upon placement of the Girders (Dead Load). The substructure consists of 6 X 1500 mm Diameter bored piles supporting a 1500 mm thick RC Pile cap.
The settlements were alarming as the pier was supported on bored piling that is supposed to be socketed at least 2000 mm into bedrock. This initial settlement of 36mm caused concern and was continuing progressively until loading and other construction activities were halted. By that time, a total of 45.7mm maximum settlement had already resulted. Fig. 1 shows the settlement profile.
The erection subcontractor for the Precast Concrete Box Girder segments specified a maximum short-term settlement of 30mm and a total maximum long-term settlement of 45mm. Clearly, the recorded initial settlements have already actually violated these values and the Box Girders have to be raised by jacking in order to level the Girders.
All construction activities were halted at this juncture and intermediate heavy steel supports were placed near the Pier support in case further settlements are experienced. These supports were also used as the reaction platform for the jacking equipment.
Fig 1. Settlement History
Our organization was engaged by the Contractor initially to undertake an investigation of the subsurface to determine the possible cause/s of the settlement which was very alarming considering that this particular Pier is supported on six (6) large diameter Bored Piles on a massive pile cap.
The following are the standard design details of the Bored Pile foundation for the project:
Number of Bored Pile N = 6
Diameter of Bored Pile D = 1500 mm
Length as installed L * = Varies Theoretical Allowable Load bearing Capacity (MT) * As designed Capacity: CStatic = 515 MT/pile
As can be seen, refusal was only encountered at a depth of 15.12 meters and 14.40 meters below existing Natural Ground Line.
Soil Profile taken across BH-1 and BH-2 as shown in Fig. 2 indicate the slightly sloping bedrock layer.
In addition to the foregoing and at a much later date, coring at the center of the Bored Piles indicated the actual gaps between the Pile Toe and the Bedrock.
A tabulation of the initial drilling results when matched against the as assumed installed depth is shown below in Table 1.
Table 1. Tabulated Values of Bored Pile Lengths and computed gap between Pile Toe and Bedrock.
As can be seen from the above figure , two of the Bored Piles (BP-1 and BP-2), even when based on the assumed installation depth, were literally resting on very soft clay and the rest were socketed only about 0.24 meters into the possibly highly weathered Soil/Bedrock Interface.
The remaining gap is about 10mm after the recorded settlements (based on this assumed installation Depth). Thus, it was possible that the clays have been squeezed out at some locations resulting in the Bored Piles resting partly on the Bedrock and partly on very soft clay.
It was suspected that the actual gap between some of the Bored pile tips and the bedrock are as thick as 150 mm before settlements occurred as detected from later corings done at the center of the bored piles as shown in Fig. 3.
Thus, the heavily loaded Bored Piles were either resting on very soft clay or on relatively weathered Bedrock very near the Soil Bedrock interface without adequate socketing.
Geology of the Site
The site across the San Juan River in San Juan, Metro Manila is generally underlain by the Guadalupe Tuff Formation (GTF), a massive suite of soft Tuffaceous Volcanic rocks. The sedimentary rocks were formed from water laid volcanic sediments thousands of years ago. The Guadalupe tuff formation is characteristically soft Quaternary Volcanic rocks.
The Pier Foundations that settled supported the Eastern end of the 60 m long girders spanning the San Juan River atop the Lambingan Bridge.
Overburden soils are relatively poor to very poor below 7 meters and consist of clays and silts down to about 15.0 meters and sloping towards the Lambingan River. The upper layers are essentially sands, which have been precompacted by traffic and various construction activities in the vicinity.
Underlying this thin overburden sandy layer is a soft to very soft layer of clays and silts which needed to be bypassed by Bored Piles to transfer the foundation loads to more competent rock.
The RQD values below the soil bedrock interface showed relatively fair values of 19% and 16% respectively.
Average Bedrock Unconfined Compressive Strengths are about 20.0 kg/cm2 near the Bored Pile Tip characteristic of soft volcanic sedimentary rock known as the Guadalupe Tuff Formation (GTF).
What Caused the Settlement?
The Bored Piles were not adequately socketed as required and were partly resting on very weak materials. During the Bored pile installation, it was possible that boulders and large cuttings were encountered which resulted in erroneous interpretation that the Bedrock level had been penetrated. No reliable report as to what actually happened could be obtained.
As stated earlier, the specification called for a minimum socket depth of 1.0m to 2.0m into bedrock. No clear or reasonable explanation could be given as to why the Bored Piles were installed short of the target depth. It can only be assumed that this was overlooked during the installation and the hole was not cleaned or inspected at all.
Since the Bored piles were terminated prematurely, and were mainly resting on very soft clays or cuttings, settlement had to ensue. This was the primary cause of the relatively large settlement that was experienced at this particular Pier location.
Remediation Measures
Immediately upon detection of on-going settlements, formal settlement monitoring and recording was started 27 January 2001. Because of the continuing high rate of settlement, construction loading was halted on February 28, 2001. Heavy Structural Steel scaffolding was placed to support the Girders and Jacking relevelled the Girders. Still settlements continued but at a reduced rate resulting in a total of 45.7mm settlement of the Pile Cap.
The ensuing check borings (Fig. 1 and Fig. 2) verified that the Bored Pile tips were resting on very soft soils or on highly weathered bedrock.
Several remediation measures were discussed and these were Narrowed down to two feasible technologies:
The Micropiling was finally ruled out due to the large lateral forces involved, which would have required extensive use of reticulated Micropiles and extensive drilling through the heavily reinforced 1.5 meter thick pile cap. The installation alone would unavoidably cause cutting of numerous rebars in critical areas of the pile cap.
The Jet Grouting solution was finally selected because it offered a far better assurance of stability during seismic loadings and also reduced damage to the pile cap rebar. As shown in Fig. 4 the solution consisted of providing a Jet Grouted Secant Wall around the footprint of the Pile Cap and at several interior locations as shown in the plan.
This Jet Grouted Curtain Wall in Secant Pile arrangement would assure full assumption of the load from the Bored Piles while at the same time increasing resistance to sliding and overturning, because of its large footprint area and “Secant wall” arrangement.
The secant wall arrangement also had the beneficial effect of compensating for the low bending resistance of the JGP by behaving as a wall providing lateral support for adjacent elements. The Final installation resulted in the use of 44 pieces of JGP elements including two clusters of 3 JGP in the interior. These were intended to fully take up the load on the bored piles during service loading effectively relieving the bored piling of any load.
A cutaway section of the remediation is shown below as Fig. 5.
A set up of the equipment underneath the Girders is shown in Fig. 6 and 7. The equipment is a Double tube Jet Grouting System with Grout injected through a side jet protected by a compressed air shroud.
In addition, each of the Jet Grouted Piles were reinforced at the center by 25mm Ø rebars which were inserted by redrilling the Jet Grouted Piles (JGP) after it has sufficiently cured, and extending this 2.0 meters beyond the Soil/Bedrock interface into competent Bedrock. The drilled holes and dowel bars were subsequently regrouted effectively doweling each JGP into the Bedrock.
Expansive admixture and higher strength mix was used to grout the rebar to the Pile Cap. This provided extra shear capacity over and above that provided at the Pile Cap/JGP Interface and also at the JGP/bedrock interface further increasing sliding resistance.
The settlement record for the project is shown in Fig. 3. The milestones are flagged. It can be seen that with the initial Jet Grouting, additional settlement of 19.3mm was experienced due to further disturbance of the weak soils near Bored Pile Tips, although care was exercised to reduce such disturbances to the minimum by initially drilling far from the Bored piles. The Girders had to be releveled again by Jacking.
The Jetting was halted to allow for the curing of the Soilcrete and also because questions were raised about the effectiveness of the technology given the additional settlements. After Field trials were done to verify the effective diameter of the JGP and the Guaranteed Compressive Strength it was shown that the Test Piles satisfied or even exceeded project requirements. Subsequently, Jet Grouting was restarted for the final Jet Grouting of 38 Piles on November 1, 2001. Only 10mm additional settlements were recorded. The Jet Grouting was completed on December 12, 2001. By this time settlements have tapered off and allowed work to be restarted on the superstructure including the laying of ballast stone.
In addition, the Project consultants required that the existing Bored piles be redrilled at the center to allow for the insertion of Grouting Pipe in order to grout the pile tip. Jetting was done to wash away the remaining soft clay on the now hanging bored piles and jet grouting with rich grout was done. This would ensure that once the “Soilcrete” had cured, the Bored pile tips would be resting on solidified ground. This was accomplished after the initial JGP installation and was done initially in areas where the JGP have substantially cured and attained full strength.
This added measure partially restored the load carrying capacity of the bored piles allowing it to contribute to the overall load capacity rather than just hang as “deadweight” from the pile cap.
The solidification at the tip of the Bored pile is shown in the figure below:
No further settlements have been recorded despite the placement of ballast and rail tracks as well as other hardware and the remediation was considered successful.
Lessons Learned
Careful monitoring of the Bored Pile installation is very important to ensure the integrity of the Bored Pile foundation including adequate and proper cleaning of the bottom from cuttings and degraded rock. It is also important to ensure that the specified socket depth is attained and adequately verified by actual inspection.
The jet grouting remediation turned out to be effective in arresting the settlements with minimal disturbance to traffic and the surrounding houses and commercial establishments. It also ensured the lateral stability of the substructure due to earthquake loading which was a primary concern .
The innovative remediation process instituted successfully arrested the settlements and restored the Pier to full serviceability.