Synopsis: The Tensile Stress (TS) and Yield Stress (YS) of rebars are the primary reference material properties and control used by the Structural Design Engineer in his design to assure that reinforced concrete members behave in a manner assumed and predicted by Reinforced Concrete Design Theory and Practice.
Almost unclear to the Engineering community is the significance of the relationship between these two values which is expressed as the TS/YS ratio.
Although the ACI Code and most international codes pertaining to Reinforced Concrete Design in Earthquake Zones, such as the UBC specify that the TS/YS ratio shall not be less than 1.25, its significance to the Design Engineer and the project manager is obscured by the focus given on the Tensile Strength and Yield Strength individually.
It is the objective of this paper to explain the critical importance of considering the TS/YS ratio and for the engineering community to understand the importance of maintaining this ratio to 1.25 or greater.
In the quest for globalization of commerce, there is a trend towards adoption of ISO Standards in the interest of “rationalization” and Fair Trade. The local committee TC-11 formed by the BPS is in the forefront of ensuring that these standards are geared to suit local conditions. Nowhere is this more important than in the issue of the TS/YS ratio for rebars which is undergoing revision. A better understanding of this issue would aid in assuring that our standards such as PNS 49 for rebars are responsive to and suited to our high Seismic Hazards and that the TS/YS ratio should be maintained.
1. INTRODUCTION
The design of reinforced concrete structures in seismically active regions require special considerations unique to this kind of exposure. Particularly in the Philippines, which has a very high seismic risk, attention to detailing of reinforced concrete takes on a very important meaning and is of high priority to the Design Engineer.
Due to the narrow focus on test results, more specifically on the individual Tensile Strength (TS) and Yield Strength (YS) of reinforcing bars, the critical relationship between the two properties expressed as the ratio TS/YS is oftentimes lost to the Design Engineer and the Construction Manager.
Worse, due to inattention or plain ignorance, higher strength reinforcing bars than originally intended in the design are passed on or accepted without realizing the dire consequences related to such actions.
More often than not, when the Engineer reviews the test results on reinforcing bars submitted by the contractor or the Independent Laboratory, he/she merely looks at these values and checks whether they meet or exceed the specified code minimum. Being satisfied that this is so, the Engineer then accepts the materials for use in the Building. In some instances this may suffice, by chance but there are many occasions where such cursory checks are not enough. It is necessary to ensure that the TS/YS Ratio satisfy the requirement contained in Subsection 5.21.2.5.1 of the National Structural Code of the Philippines and the ACI Code as it pertains to Earthquake Resistant Design.
This subsection reads:
“5.21.2.5.1 Reinforcement resisting earthquake induced axial forces in frame members and in wall boundary members shall comply with ASTM A-706 PNS 49. Grades 275 and 415 reinforcement are allowed in these members if (a) the actual yield strength based on mill tests does not exceed the specified yield strength by more than 120 MPa (retests shall not exceed this value by more than an additional 20 MPa) and (b) the ratio of the actual Ultimate Tensile Stress to the actual yield stress is not less than 1.25.”
At first glance, the above requirements may seem baffling, for why should there be a ceiling cap placed on the yield stress? Why are the steel Grades limited to PNS Grades 275 and 415 for Seismic Design? Isn’t stronger necessarily better? Also, why should there be a mandatory minimum value of 1.25 applied on the Tensile Stress to Yield Stress ratio.
Clearly, there is a need for an explanation. This explanation is conveniently and clearly found in the commentary of ACI 318 R-95 most specifically commentary R 21.25. (See Appendix “A”)
However, as stated earlier, the importance of these provisions and the reasons behind it are obscured or lost or relegated to the background.
To confound this issue, there is a move to realign our standards with that of the world, mainly thru adoption of ISO Standards in keeping with liberalization of trade and elimination of barriers to trade.
Present ISO standards, the so called EUROCODES require a TS/YS ratio of 1.05 and 1.08 which is very much below the ratio 1.25 given in our present NSCP Code and PNS 49.
Tests conducted in Italy, Macchi (1996) which is also a seismically active region, indicate that these values are inadequate to ensure ductility under simulated earthquake loading.
The Bureau of Product Standards TC 11 – Committee or Steel Products (of which the author is a member) is at the forefront of this activity. Representation by ASEP in this committee will help to preserve the existing TS/YS ratio of 1.25.
In addition, the engineering community should insist that the TS/YS ratio be published on all mill certificates and laboratory test results to ensure that this requirement is amply satisfied and the end user properly informed.
It is the purpose of this paper to expound on these requirements in the hope that a greater understanding of these provisions would result in giving these due importance and attention that these deserve.
2. PRACTICAL AND THEORETICAL CONCEPTS
In order to understand the foregoing issues at hand, we would need to review and/or understand some very critical aspects related to seismic design.
2.1 Stress Strain Behavior of Steel Reinforcing bars in Uniaxial Tension
Steel behaves as a linearly elastic material within the elastic limit (stress is directly proportional to strain) until yielding occurs. Beyond this point and prior to ultimate failure, stress is no longer proportional to strain. However, considerable strength development after a yield plateau is developed, occurs (although non-linear) prior to failure.
This region is known as the strain hardening region where further strength gain results due to proportionately larger strains imposed. Beyond the strain hardening region, further straining results in strain softening until failure occurs. The peak stress is considered the ultimate stress.
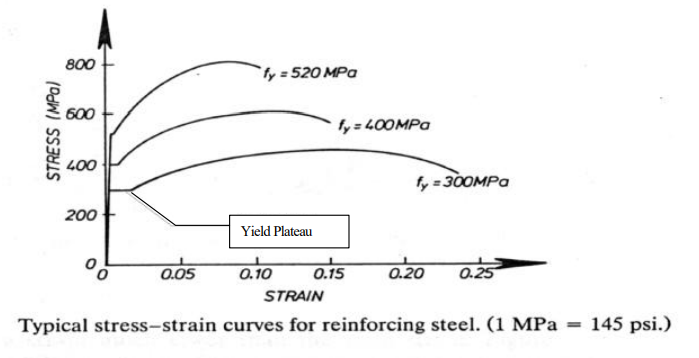
The typical curve shown below is taken from (Paulay and Priestley, 1992):
The above typical stress strain curves indicate that ultimate strain and the length of the yield plateau decrease as the yield strength increases. This development is not at all desirable because the steel stress that may develop in a section may greatly exceed the yield stress leading to shear failures or unexpected flexural hinging. It would be therefore desirable to limit the steel grades used as indicated by NSCP 5.21.2.5.1.
2.2 Ductility Versus Brittleness
The term ductility refers to the ability of a member to undergo large deformations without rupture as failure is occurring. Ductile members could therefore bend and deform excessively but they remain intact. This essential capability of properly designed and detailed RC members ensures against total structure collapse and provides protection to building occupants at the critical instant when failure is occurring. Brittle members on the other hand fail suddenly and completely with very little warning. This sudden failure may damage adjacent elements or overload other portions leading to progressive total collapse.
Ductility includes the ability to survive large deformations and a capacity to absorb energy by hysteritic behavior. For this reason, it is the single most important property sought by the designer of buildings located in regions of high seismicity. It is therefore necessary to ensure ductility of members to allow visible development of large deformations before total collapse occurs, thus providing ample warning to occupants.
While ductility is assumed by proper seismic detailing provision, it is equally important to ensure that the reinforcing bars behave as intended by maintaining a cap on the yield stress and by ensuring that the TS/YS ratio is > =1.25.
In general, seismic forces that could be developed in a structure during a seismic event decrease with increasing ductility. However, the amount of ductility permissible may be a function of acceptable deformation magnitudes.
2.3 Structure Stiffness
The structural response of structures to earthquakes is dependent on the relative stiffness of the system, the ability of the system to dissipate energy and the inherent ductility of the system.
A rigid structure will attract load during an earthquake; more flexible structures will develop smaller seismic forces. However, the degree of flexibility that may be acceptable is limited by the effects of large lateral displacements resulting from flexibility (Kinitzsky et al 1993).
2.4 Reinforcement Percentage
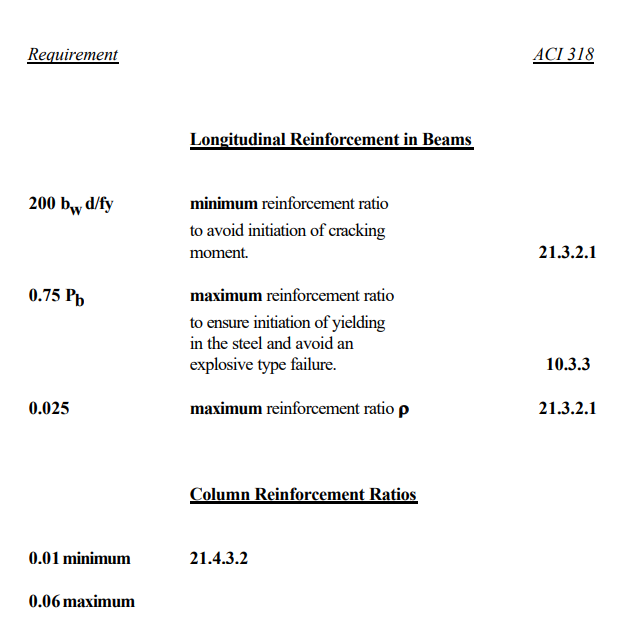
The amount of steel reinforcement commonly expressed as a percentage of area of steel to concrete is important in Reinforced Concrete Design and more so in seismic resistance of RC Structures.
In an over reinforced flexural member (large steel percentage) the failure mode is brittle. This is because crushing failure of concrete is reached before yielding of the reinforcement occurs.
The same failure mode is realized in an under reinforced beam. When the tensile stress of the limited steel area is reached, the modulus of rupture of concrete is exceeded causing the concrete to crack and immediately release this load on the steel reinforcement. If the steel area is too small to carry this force, the rebar will snap and cause sudden failure.
Ideally the only desirable mode of failure, a ductile one, can be induced by moderate percentage of steel. This failure is initiated by gradual yielding of the steel while concrete strains are still relatively low. Thus, large deflection are attained before final collapse occurs Leet (1991).
From the foregoing concepts, the following conclusions could be made:
Ductile behavior should be assured through careful material selection, design and detailing.
Some flexibility in the structure is needed to reduce seismic forces through energy absorption and dissipation.
Moderate levels of reinforcement should be used to assure ductile behavior.
3. THE TS/YS RATIO AND ITS IMPORTANCE
There have been many occasions in the past where overstrength reinforcing bars (Higher Yield and/or Higher Tensile Strength) are innocently accepted by the Design Engineer or passed on by the supplier as the specified grade in the mistaken belief that stronger is necessarily better. Sometimes higher grade steels failing to meet the specs are downgraded and used as lower grade reinforcing bars.
In another previous paper by this author Morales (1997) this matter had been brought to the attention of the Engineering community. However, it was felt, due to the ongoing deliberations on trade liberalization and rationalization that this issue be delved with in more detail so that its implications could be fully understood.
In some occasions too, the Engineer does not even see the test results and relies on his Junior Engineer to monitor them. The Junior Engineer, lacking in experience and knowledge upon seeing that the test results are greater than the specified, reports that everything is well and so the problem does not get attended to until it is too late.
These real life examples bring to fore the need to understand the important of the TS/YS ratio and why greater attention should be given to test results. Let us now discuss the technical issues involved and its effect on our structures.
3.1.1 Yield Strength (YS)
The NSCP, which also echoes the requirements set forth in ACI 318 and the Uniform Building Code of the USA, sets a cap or limit to the Yield Strength of Reinforcing bars. More specifically it requires that:
“a) The actual yield strength based on mill tests does not exceed the specified yield strength by more than 120 MPa (retests shall not exceed this value by more than 20 MPa).”
Definitely, there must be a reason behind this requirement.
A very much higher yield strength than that nominally assumed in the design is fraught with problems.
A higher yield stress will: Paulay (1992)
Induce higher concentrations of shear and bond stresses at time of development of the yield moments during seismic loading. Shear and bond type failures are explosive and brittle modes of failure and should therefore be avoided.
Attract larger lateral forces as a rule because energy absorption initiated at yielding or partial yielding is postponed and thus higher seismic inertia forces are generated further complicating the problem.
Prevent the formation of an extended yield plateau which is undesirable. An extended or longer yield plateau is desirable and stems from requirements of capacity design. It is necessary that the shear strength of all elements and flexural strength of sections not intended as plastic hinges should exceed the forces corresponding to development of flexural overstrength at the designated plastic hinge locations. If the rebar exhibits early and rapid strain hardening, the steel stress at a section with higher ductility may exceed the yield stress by an excessive margin.
If there is considerable variation in the yield strength, the actual flexural strength of a plastic hinge may greatly exceed the intended value postponing its formation until more critical loading is sustained.
3.1.2 Tensile Strength (TS)
Higher Tensile Strengths invariably means increased Brittleness. This is indicated by a reduced yield plateau and a very limited strain hardening region. This means that the yield region and its capacity to absorb energy through inelastic deformation is severely limited. In addition, the use of higher Tensile Strengths if unanticipated in the design could also correspondingly elevate the yield stress leading to problems stated earlier in the discussions on the implication of a higher Yield Stress (YS).
For this reason, the NSCP and the source codes (ACI 318 and UBC) limit the allowable steel grades for use in seismic regions.
3.1.3 The Ratio TS/YS
The unique material strength properties TS & YS are individually important to consider and control as they influence the behavior of structures during seismic excitation as discussed earlier.
Taken together as the Ratio TS/YS (known as the “Strain Hardening Value” in European practice), it indicates the ductility capacity of the structural member or component where it was used.
The larger this ratio, the better for the structure.
A large TS/YS ratio means a greater energy absorption capability before failure. In addition, larger deformations are experienced which could serve as visible warning to building occupants prior to total failure or collapse.
Less Brittle behavior therefore is experienced.
Professor Giorgio Macchi of the University of Pavia, Italy conducted experimental tests to determine the effect of the strain Hardening Value TS/YS on the performance of full scale RC columns subjected to Lateral Loads with or without axial loads. His findings contained in his published report “Ductility Requirements for Reinforcement under EuroCodes “ Macchi (1996) revealed very interesting findings which underscored the necessity of maintaining a high TS/YS value or the Strain Hardening Value .
We summarize his findings contained in this report:
Details incorporating relatively low TS/YS ratios (<<1.25) showed that concentrations of Plastic strains are in a very limited vertical region of the test specimens. As a consequence, the very high local curvature was necessary for the required displacement causing considerable local deterioration and premature damage. This led to destruction of the concrete cover. The lack of confinement of the concrete cover allowed the bars in compression to buckle. The bars then failed in tension under reverse action.
Reinforcing bars with TS/YS ratio of 1.4, as used in the tests, showed that plastic deformation spread over a considerable length along the specimen because of the high strain hardening value . Local curvature was smaller, the concrete cover remained intact and the bars did not fail. The RC member, therefore sustained higher top displacement.
Insufficient strain hardening leads to high concentrations of strain.
Insufficient steel elongation initiates earlier steel fracture at ultimate loads.
There should be a cap or limitation on overstrength of reinforcing bars.
4. EFFECT OF BOND STRENGTH ON FLEXURAL DUCTILITY
There have been concerns expressed earlier Cairns (1994) that improvements in the stiffness of bond force-slip relationship of reinforcing bars resulting from increases in the relative rib area of deformations may have a negative impact on the flexural rotation capacity (flexural ductility) of RC Beams. Similarly, there have been discussions in Europe aimed at reducing the relative rib area of reinforcing bars to improve Ductility.
Tests conducted by (Tholen and Darwin, 1995) have shown that a relatively large change in relative area has no measurable effect on the distribution of flexural cracks or on the displacement and rotational capacity of beams in which plastic hinges develop. Concerns on either point have been proven to be not justified.
The foregoing has been included if only to underscore the critical importance of the TS/YS ratio in assuring ductility, as any influence, no matter how it may seem insignificant to the uninformed, is being looked into by the engineering community to assure that ductility is enhanced and not diminished.
5. CONCLUSIONS
This paper has focused on the need to look into the importance of assuring ductility of RC structures not only through proper and adequate seismic detailing but also by proper understanding and selection of Material properties. Of these, it is necessary to ensure that Reinforcing bars used in the structure meet the requirements of NSCP Subsection 5.21.2.5.1 particularly as it applies to a cap on the Yield strength and the prescribed minimum TS/YS ratio of 1.25 . This paper also reiterates the need to erase the misconception that higher strengths invariably mean stronger structures.
The specified minimum TS/YS ratio of 1.25 helps to impart ductility to structures by:
Assuring that significant energy absorption and dissipation occur during inelastic deformation.
Preventing the premature failure of reinforcing bars due to brittle behavior.
Guaranteeing that plastic hinging develops at intended locations.
Avoiding premature failure due to strain concentrations.
REFERENCES
ASEP (1992) National Structural Code of the Philippines Volume 1. Association of Structural Engineers of the Philippines (ASEP), Manila.
ACI (1996) ACI Manual of Concrete Practice Part 3. American Concrete Institute (ACI), Farmington Hills, Michigan.
Paulay, T . and Priestley, M.J.N. (1992) Seismic Design of Reinforced Concrete and Masonry Buildings, pp. 114. John Wiley & Sons, Inc., U.S.A.
Krinitzsky, E.L., Gould, J.P. and Edinger, P.H. (1993) Fundamentals of Earthquake Resistant Construction, pp. 203. John Wiley & Sons, Inc., U.S.A.
Leet, K. (1991) Reinforced Concrete Design, Second Edition, pp. 84-95. McGraw- Hill, Inc. , Singapore.
Tholen and Darwin “Effect of Reinforcing Bar Deformation Pattern on Flexural Ductility”. ACI Structural Journal, V95 No. 1 January 1998 pp. 37-41.
Macchi, G. (1996) “Ductility Requirements for Reinforcement Under Euro Codes”. Structural Engineering International, April 1996.
Morales, E.M. (1997) Seventh International Convention on Structural Engineering: Facing the Challenge of Economic Growth “Stronger is Not Necessarily Better – The Significance of Tests and Properties of Civil Engineering Materials”. Manila Midtown Hotel, Pedro Gil cor. M. Adriatico Street, Ermita, Manila
ABOUT THE AUTHOR
Emilio M. Morales, MSCE took up his masters degree at the Carnegie Institute of Technology, Carnegie-Mellon University, Pittsburgh, PA. USA in 1980. Formerly Senior Lecturer of Graduate Division, College of Engineering, University of the Philippines, Diliman, Quezon City. Presently, he is the Technical Manager of Philippine Geoanalytics, Inc., Civil Engineering Laboratory and Principal of EM2A & Partners & Company. Committee Member, TC-11, Bureau of Product Standards Technical Committee on Steel Products.
He can be contacted at: EM2A Partners & Co., No. 17 Scout de Guia corner Scout Reyes Streets, Diliman, Quezon City. Telephone Nos. 371-18-04 & 06/ 410-29-23. Fax No. 3744338; E-mail: em2apart@pgatech.com.ph.
Emilio M. Morales, CE, MSCE, F.ASCE, F.PICE, F.ASEP 1]
Abstract : The application of Soil Mechanics principles in day to day construction practice involves an appreciation and keen understanding of soil properties and soil behavior in order to provide adequate and cost effective solutions. Oftentimes, the fundamental understanding of soil behavior and how to apply it to advantage is lost leading to costly mistakes and time delays. This paper aims to unify Soil Mechanics principles and Fundamental knowledge to the solution of construction problems involving earthworks and foundation. Further reading is recommended as this paper in no way can claim to be complete in defining soil behavior and the various factors influencing its properties and behavior.
The Construction professional is oftentimes confronted by seemingly puzzling problems in construction defying solutions. These problems particularly occur during earthworks or foundation construction. Unlike the construction of the superstructure where the professional is familiar with the properties and behavior of man-made construction materials, working with the soil is often times fraught with uncertainties and sometimes with the unknown behavior of soils and rocks.
These uncertainties happen due to various factors that are not known immediately because soil is a natural material and has varying characteristic properties and behavior depending on a myriad of factors which need to be understood.
The following are some of the factors that have a likely effect on the final soil behavior or characteristic property:
Soil or Rock Mineralogy
Manner of Physical Deposition
Presence or absence of Water
Effect of Physical forces acting on it such as load history or Disturbances from Vibration etc.
We shall also discuss the Problems and solutions that are influenced by the foregoing factors and some, by citing various experiences encountered in normal day to day construction activities.
2 SOIL OR ROCK MINERALOGY
2.1 Soil as a Particulate Material
Under a very powerful electron Microscope, even a piece of seemingly solid mass of clay appears as an assemblage of particles with some orientation. This orientation surprisingly can be altered by reworking of the clay, addition of or removal of moisture or by altering the chemical make- up of the porewater.
Under normal conditions, it would also be noted that the assemblage includes water and air. The water is either captured or adsorbed water or free water.
The process of compaction is nothing but the expulsion of air (reduction of voids in the soil). Thus, our attention is directed as to how this could be most efficiently done.
However, as we know, this assemblage that we just saw in the Electron Microscope is only but one of two major assemblages that soil can assume depending on its granulometry or Grain Size.
Soil can either be:
Coarse Grained (Sand) or Cohesionless
Fine Grained (clay) or Cohesive
The clear distinction between the two are somewhat obscured by their combinations or mixtures that could be found in nature. In their unadulterated states, the differences become readily apparent or clearly distinguishable.
2.2 Clay Microstructure
Let us now peer again at our microscope to look at a sample of cohesive or fine grained clay soil.
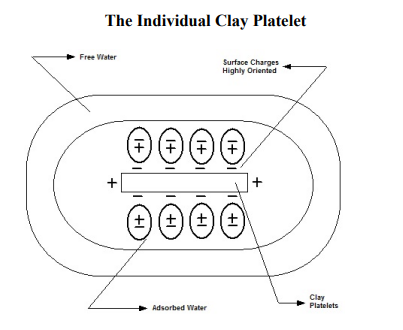
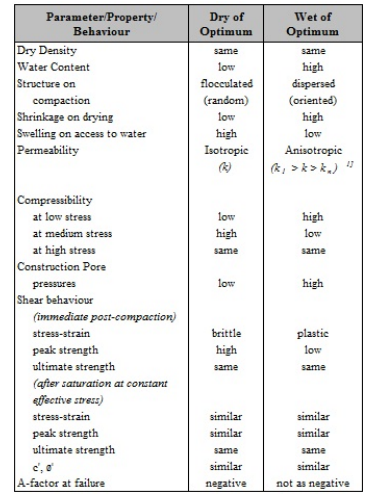
As we can see, the clay is composed of submicroscopic platelets surrounded by Electrical charges, a closely held layer of adsorbed water and an outer layer of loosely held water. The interparticle distances, measured in Angstroms Ǻ are governed not only by the particle orientation but also by the Electrical forces of attraction as well as the thickness of the adsorbed and free water. It would take a very high input of energy in order to dislodge or remove the adsorbed layer. However, the loosely held water can be removed in the field by sample air drying or windrowing or application of pressure. Once the free water is removed, compaction can be attained. These electrochemical forces give the clay its characteristic strength known as Cohesion. The particle orientation as we shall see in the succeeding table also affects some other physical performance characteristics of the soil.
2.3 Microstructure of Fine Grained Soils
Fine Grained Soils, because of their sub microscopic size are influenced by Electrical and Chemical forces of attraction and repulsion. This is due to the fact that the ratio of specific surface area to their volume is so large that surface electrical activity greatly influences the behavior of fine grained soils.
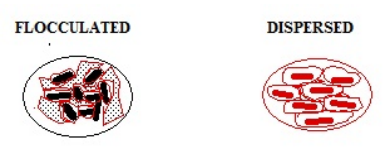
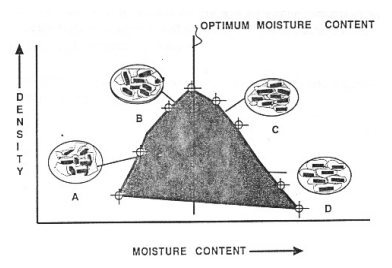
In nature, fine grained soils assume a flocculated or dispersed configuration as shown below depending on the manner of deposition and environmental influences that it has been subjected to.
A flocculated structure assumes a random tip to side orientation much like a “house of cards” whereas a dispersed structure has the platelets more or less aligned to each other.
The arrangement of these platelets alone has an influence on the performance and behavior characteristics of the soil.
2.4 Sand Particles
Obviously we do not need a microscope to be able to see the coarser granular structure of sandy soils. In fact this can be done with the naked eye.
Very dry sand in the hand cannot be squeezed into shape whereas semi moist sand when squeezed could hold some shape until it dries out and crumbles. Surprisingly, addition of more water to saturate the sand collapses the sand as in the very dry state. Sand lacks real Cohesion and is therefore termed Cohesionless soils. It derives its strength in nature through interparticle friction and grain to grain contact stresses. Sands are therefore friction type materials with a Phi Angle Ǿ to define its characteristic resistance to shearing or sliding. However, this property is not a unique value and would depend on the state of the grain to grain contact arrangement as well as the normal forces that are providing the stress and confinement.
Sand when unconfined and loosely dumped assumes an angle of repose which would correspond to approximately its lowest Phi Angle Ǿ value.
2.5 Behavior of Highly Fractured and/or Jointed Rocks
A special case of a particulate behavior is highly fractured rock. Although it may appear intact and solid when exposed, highly fractured rock can behave as a particulate material when disturbed. Therefore, care in understanding the actual condition of rock is important particularly when making large open cuts in it.
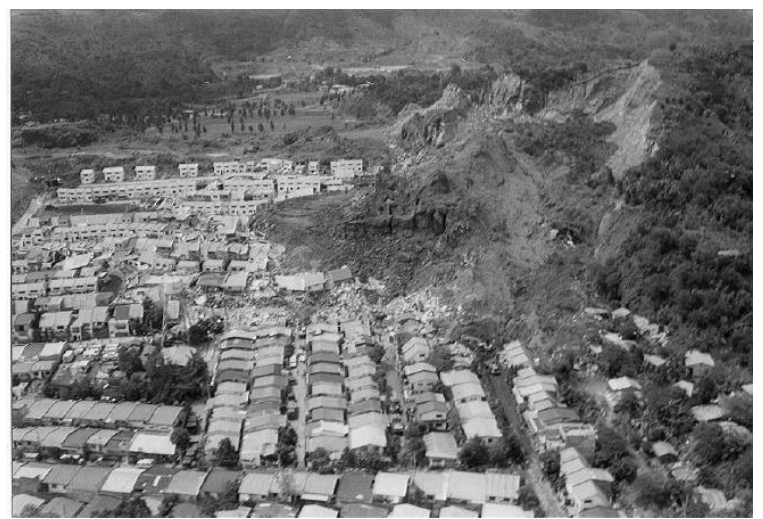
Other than the jointing of the rocks, the dip or inclination of the bedding plane could also sometimes trigger instability in rocks when exposed in cuts simply due to the forces of gravity acting on the Particulate rock mass. Thus, care is necessary in trying to predict the actual behavior of rocks whether it will behave as a solid mass or as a particulate material. Otherwise, disasters can happen such as in the Cherry Hills Landslide.
3 MANNER OF PHYSICAL DEPOSITION IN NATURE OR PLACEMENT IN FILLS
The manner of deposition also influences the physical behavior of soils particularly for sands but also for clays. Whether laid gently or violently by agents of deposition such as water or wind, the soil behaves in accordance with the final state when deposited.
3.1 Effect of Natural Agents of Deposition
3.1.1 Deposition of Sand in Nature (Water Laid)
When grains of dry sand are gently deposited in a container, they fall into place in a precarious grain to grain contact. A jarring motion imparted on the container causes the grains of sand to assume a denser packing. Slight addition of water causes the sand to swell or increase in bulk while saturation with just enough water that is somehow allowed to drain causes the sand to be compacted into a dense state. This has been known to us since time immemorial as Hydrocompaction. This knowledge of Hydrocompaction is used for the compaction of clean sands in construction and we shall see why this is so. Perhaps only the mechanism behind it is not well understood.
3.2 Effect of Compactive Effort
Having recognized the behavioral characteristics of soils (Particulate Material) we now look at the means to achieve compaction in the Field.
However, try to remember the fundamental response of the two general types of soils to compactive effort.
Loose Clean Granular Soils, because of their precarious grain to grain contacts, are best compacted by causing a jarring motion or vibration such as what a vibratory roller would impart. In addition, saturating the sands immediately before compaction allows for increased compaction effectiveness.
Fine Grained Clay Soils; on the other hand respond better to a kneading type of compactive effort such as that imparted by sheepsfoot rollers and pneumatic type rollers as these tend to reorient the platelets. Clays are best compacted by a kneading motion say from a Static sheep’s foot or tamper foot roller with a controlled Moisture content very near or at the Optimum Moisture Content.
We can therefore see the effective ranges for various compaction equipment under differing soil conditions and we recognize right away that this has something to do with the grain size (clay to rock).
At first glance, it could be said that this is a very familiar and well accepted practice.
4 SOIL SHEAR STRENGTH
4.1 Clays
Particulate materials derive their strength from friction or intergranular contact and/or from bonding forces or cohesion as we know it. These bounding forces and friction prevent the particles from sliding.
The most important soil strength property that we have to deal with is the soil’s Shear Strength or Cohesion since most of the loading that the soil is subjected to causes the individual soil particles to slide or “shear” one against the other because of their very fine particulate character.
Depending on the granulometry of the soil and its moisture content, the shear strength is either derived from electrical and chemical forces of attraction (cohesion) and repulsion as in clays or by simple practical grain to grain contact and friction as in Pure Granular Materials. Since shear strength depends on the integrity of the sliding resistance of the individual soil particles, it only follows that the more compact the soil becomes, the higher the shear strength and vice versa. The only way to cause this increase in strength is to lessen the interparticle distances by the expulsion of air and/or water or by cementing it which is sometimes resorted as in soil cement if good materials are not readily available.
Near total expulsion of the moisture under high heat will cause the fusion of the clay particles as in pottery.
This leads us to one of the Fundamental Principle in Earth Compaction:
“Increasing Density (Strength) is achieved by decreasing the soil interparticle distance through the expulsion of air or water or both.”
As we shall see later on, reduction of interparticle distances would sometimes require addition of more water into the soil in order to dislodge more water. This statement appears to be confusing and contradicts logic but its proof reiterates the importance of the understanding soil particulate behavior in the solution of Earthwork Problems
1]k1 is permeability in a direction parallel to particle orientation.
kp is permeability in a direction perpendicular to particle orientation
The table above therefore suggests that we can alter the performance and behavior characteristics of the clay soil to suit our specific needs if only we know how.
As an example, an experiment with a clay material was made to determine the effects of compaction water on permeability. It can be noticed that although compaction density is the same left and right of optimum, the permeability values are not the same for this specific type of soil.
4.2 Sands
Sands on the other hand possess frictional resistance which is dependent on the confinement of the soil as well as the normal stresses pressing and the individual grains to have intimate grain to grain contact.
As we have stated, this property, this parameter, known as the Phi Angle Ǿ is not unique and depends on the foregoing factors.
5 PRESENCE OR ABSENCE OF WATER
5.1 Sand
Very dry sand in the hand cannot be squeezed into shape whereas semi moist sand when squeezed could hold some shape until it dries out and crumbles. Surprisingly, addition of more water to saturate the sand collapses the sand as in the very dry state.
When grains of dry sand are gently deposited in a container, they fall into place in a precarious grain to grain contact. A jarring motion imparted on the container causes the grains of sand to assume a denser packing. Slight addition of water causes the sand to swell or increase in bulk while saturation with just enough water that is somehow allowed to drain causes the sand to be compacted into a dense state. This has been known to us since time immemorial as Hydro compaction. Perhaps only the mechanism behind it is not well understood.
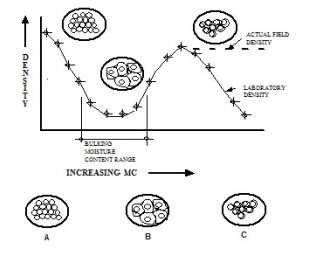
We now look at the Moisture Density relationship curve for a coarse grained sand with very little or no fines.
Since the individual grains are relatively very large compared to the clay platelets, we know that surface electrical forces play very little influence on the behavior except at a certain moisture content range.
We see right away that the Moisture Density curve indicate two density Peaks “P1” and “P2” where density is high. The first Peak P1 occurs when the soil is very dry (MC = 0) and the other Peak P2at almost saturation conditions. We also see that between these two Peaks is a valley where density is lowest.
The reduction in density in this valley as defined by a moisture content range is known as the “Bulking Range” for this particular sand.
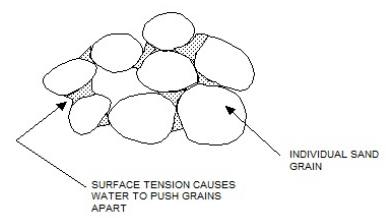
This reduced density is caused by surface tension forces of the water surrounding the individual grains which tend to drive the adjacent grains farther apart, causing loss of interparticle contact and collapse in the density from the previous high.
However, progressive addition of water beyond the bulking range collapses the surface tension and the additional hammer impacts increases the density again to the second Peak “P2”. The laboratory curve shows a downhill movement in density with increasing moisture content beyond saturation levels.
The real field curve shown by the dotted line suggests otherwise. The reason behind this is that in the laboratory compaction procedure, the water cannot drain within the steel compaction mold and thus the soil becomes a soupy mush. However, in the field, additional water is continually drained and the Peak density is maintained.
This curve clearly shows the fallacy of specifying Proctor Compaction Procedures and an OMC for clean coarse grained soils, because definitely, the soils are insensitive to moisture content except at the very dry and very saturated conditions. Unlike clay soils which follow a typical bell shaped curve, clean coarse grained soils exhibit a typical “S” shaped curve with the Peaks P1& P2 clearly distinguishable.
Peaks P1 & P2 may sometimes be equal but this is more of an exception than the rule and their relative maximum values could shift either way depending on the type of soil.
This soil behavior has been recognized by ASTM and standardized into two standards ASTM D-4253 “Max. Index Density of Soils using a Vibratory Table” ASTM D-4254 “Min. Index Density of Soils and Calculation of Relative Density” to arrive at a minimum and maximum density. These values are then used to compute the Relative Density DR once the Field Density is obtained.
Compaction is specified not in terms of % of MDD but rather as Relative Density DRand their relationship to each other is shown in Scalar Fashion.
5.2 Clay
In the case of fine grained soils such as clays, interparticle forces play a significant role in the behavior of the soil.
The readily recognized “Bell” shaped curve traces the density of the soil when subjected to increasing moisture content under laboratory compaction. The increasing amount of water combined with application of compactive effort increases the density with a change in soil structure. The soil tends to imbibe water until a Threshold is reached called the Optimum Moisture Content (OMC). Beyond this, increasing water is absorbed with a corresponding decrease in density as the captured water pushes the individual clay platelets farther and farther apart. The Laboratory curve would then assume a perceived Bell Shape.
In actuality, and in the field, the increasing moisture content would then to collapse the soil and turn it in to mush or mud.
Thus, beyond the OMC point, any increase in water content would tend to decrease the density and conversely, increasing the compactive effort beyond the optimum will not achieve adequate compaction.
5.3 Swelling Soils
Swelling soils find wide distribution in areas of volcanic deposition or origin with tropical climate and also in arid and/or semi desert climates. In tropical volcanic settings. Alumina rich volcanic ash gets deposited in general over a wide area. Some get concentrated in depressions or low areas which are almost always inundated or saturated with water. This regular inundation tends to leach the alumina and concentrate these at the bottom 1.0 meter to 2.0 meters generally but could be deeper depending on the leaching effects.
This explains the sporadic occurrence of expansive soils as generally, the expansive soils are not deposited area wide and thus portions of the project footprint may or may not be underlain by these soils.
In tropical volcanic environments, volcanic soils rich in alumina are deposited as Aeolian deposits. These Aeolian deposits settle in the land and are thicker in depressed areas. The alumina gets leached and concentrated due to ponding and saturation in the depressed areas. This alumina is the primary source of the expansive tendency and most often are shallow in occurrence due to the limited leveling effects.
Swelling soils are generally fine grained clay soils with very high plasticity. These clay soils have very high affinity for water and the adsorb and absorbed water tend to push the individual soil platelets apart with relatively very high expansive pressures.
The swelling soil or expansive clay have caused Billions of Dollars of annual Damage in the US and unquantified damage here in our country.
Most often, heave or swell is mistaken as Settlement with costly results as the direction of remediation may not be effective at all or even cause more harm as experienced by the author in a specific project.
5.3.1 Moisture Density Relationships
We begin with the all too familiar moisture density relationship known as the “Laboratory Proctor Test” for a clay soil.
Our “total familiarity with this simple bell shaped curve and its universal acceptance as the “characteristic” compaction curve has caused most of the problems we encounter today in Earthworks compaction. Too often, it has not been realized that this is not the only shape a laboratory Proctor curve can assume and that grain size and moisture play a great part in influencing the shape of the compaction curve.
This bell shaped curve as, we shall see later on, is only applicable for fine grained soils or soils with significant plasticity as to make it perform as a clay like soil.
As we can see, at the start of the test when the soil is relatively dry, the soil assumes a flocculated structure “A” additional mechanical reworking and increasing amounts of water and subsequent expulsion of air and closing of the voids tend to produce a semi flocculated structure “B” with increasing density until a peak is attained. This peak is the maximum density that could be attained by that type of soil in the laboratory. This is expressed in terms of “Relative Compaction” which is a percentage of the maximum dry density obtained in the laboratory test.
The moisture content corresponding to this maximum density is known as the Optimum Moisture Content “OMC”. Further compaction and additional water beyond this point result in decrease in density with increasing amounts of water. The soil platelets begin to be oriented and aligned and the interparticle distances tend to widen as more and more water is captured.
Recognition of the two characteristic compaction curves (The “Bell” and the “S”) leads us to the realization that clays and sands behave very much differently when compacted and require different approaches and solutions.
We also know now that the behavior of soils can be tempered to suit our requirements as shown in the foregoing table particularly for a clayey soil.
Thus, we are led to the following conclusions:
There is not one but two General characteristic curves for soils depending on their granulometry.
The concept of Optimum Moisture Content generally does not apply to Clean Granular Soils and therefore the Proctor Standard is inappropriate or could lead to problems in the Field.Clean sands either have to be compacted very very dry or very wet in order to achieve the maximum density.
The microstructure of the soil needs to be considered in the selection of the right compaction equipment.
For Fine Grained Soils, although density is the same for corresponding points left and right of the OMC, the performance and behavior of the soil are different due to the alteration in the microstructure arrangement.
Beyond the maximum density, additional compaction energy would be detrimental to both clays and sands as breakdown can occur causing a decrease in density.
Therefore, use no more than what is necessary to attain good compaction.
For intermediate soils, it would be necessary to determine in the laboratory the characteristic behavior from zero MC to saturation levels.
In case the laboratory curve is not clearly defined or when there are doubts as to the behavior in the field, a field compaction trial would be required.
6 EFFECTS OF PHYSICAL FORCES ACTING ON THE SOIL
6.1 Effect of Vibrations on Loose Sands
Loose clean Dry sands when subjected to vibrations say from earthquakes, explosives or vibrating machinery tends to rearrange to attain a denser packing by filling up the large void spaces. This rearrangement can cause significantly large settlements which in turn can cause distress.
This is different from the behavior of Saturated sands when subjected to earthquake or other exciting sources discussed later.
6.2 Soil has an “Autographic Memory”
One very important fact often overlooked is the fact that soil has an Autographic memory or it remembers past loading history. If say for example, a soil is loaded in the past by a hill or a mountain or a very old structure, and the load is suddenly removed, the soil remembers the past preload and any load imposed on it not exceeding this past preload will not in any way cause settlement or bearing capacity problems.
This fundamental fact is put to good use when determining the actual Mobilizeable Soil Bearing Capacity of buildings on massive cut areas or deep basement levels. The weight of the soil removed is considered as Overburden Relief which can be added to the theoretical mobilizeable bearing capacity.
Also, when soft soils are consolidated and stabilized by a load surcharge, the soil remembers this surcharge load and a load slightly less than this surcharge can be imposed on the soil without any further settlement or bearing capacity failure.
7 BEHAVIOR UNDER COMPACTION-CASE STUDIES
Very often the Earthworks Contractor is confronted with a clear set of specifications from the Design Engineer outlining specified compaction density, moisture content and governing standards. In most instances, the contractor innocently and faithfully tries to carry out the procedure in the field without a clear understanding of what is really required and without a fundamental understanding of the Soil Mechanics principles entailed in such a “simple” task as Earthwork construction. This ignorance and oversimplification often produces disastrous results, delays in the project and financial loss to the contractor. Unfortunately, it is sometimes not only the contractor but also the Design Engineer who is ignorant of these principles, thus confounding the problem which could again further cause delays in the project. What is also dishearthening is the realization that all too often this “failure” on the part of the contractor results in countless litigation or delays because the real problem could not be identified.
The statement “problem identification is Eighty Percent of the solution” is nowhere very applicable as in this problem.
Let us consider several cases which highlight what we mean:
7.1 Runway Construction Project
A very large runway project inside a U.S. Base required a minimum of 95% of Maximum Dry Density based on ASTM D-1557 (Modified Proctor) on the subgrade which consisted of Clean Coarse Grained Materials (Granular Sand).
The contractor proceeded to do the compaction utilizing about 20 units of large Vibratory Rollers and Two (2) Water Trucks.
We were hired as the Independent Q.C. Laboratory to monitor Field Compaction. The contractor almost consistently had very large number of Field Density Test “Failures” despite numerous passes (about 10 to 12) per lane.
We were asked to look into the problem as substantial delays have been incurred without significant progress. After conducting compaction trials on a 100 meter strip for half a day, we were able to achieve adequate compaction in just 3 passes!
The procedure we used in the compaction trials was immediately implemented which resulted in almost halving the vibratory compactor fleet (rented) but increased the number of water trucks to 4 at tremendous savings to the prime contractor. This also enabled the contractor to accelerate subgrade preparation by at least two (2) months.
What happened was not black magic but just the sound application of Soil Mechanics principles as we shall see later on.
7.2 Housing Project at Subic
In a housing project inside the Subic Naval Base, an American Contractor was required by the contract specifications to compact the soil to 95% of Maximum Dry Density again based on ASTM D-1557. After several rectangular slabs for the duplex housing were poured, and after a heavy downpour, two of the recently poured slabs broke neatly into two at the center.
We were called in to do consulting work to solve the problem and we found out that it was a swelling soil problem.
After the study and a long protracted fight with the U.S. Navy Engineers out of Honolulu, the Navy adopted our recommendation on the basis of a “no-cost change order.”
Surprisingly, what we recommended was to bring down the compaction levels to 90% of Maximum Dry Density Based on ASTM D-698 instead of the more stringent ASTM D- 1557 (Modified Proctor) (The latter having the effect of increasing the energy input or compactive effort by 4.58 times!) and to compact the soil Wet of Optimum.
Clearly this was an “Inferior” substitute that was accepted without a reduction in the contract amount.
Why was the change possible?
7.3 Lahar Project
We were again involved to do preliminary consulting work involving Lahar as a Construction Material for a significant Lahar Protection Structure. The initial specifications called for Proctor Densities and Specified the Optimum Moisture Content required.
Since the structure would be constructed during the dry season, water was a big problem that could hamper the construction of the structure in time for the next onslaught of Lahar.
We have done preliminary work on Lahar on our own as a matter of professional interest and we knew that Lahar behaved as a clean granular soil.
Therefore, we recommended that the Lahar ought to be even compacted in a very dry state. After a lengthy explanation and initial disbelief, everybody agreed to do so and thus eliminated an unnecessary requirement which could have even hindered the construction progress or even resulted in the specifications not being attainable in the field.
Again, a timely intervention applying sound Soil Mechanics principles saved the day for the project.
7.4 Stalled Vehicle Wheel in Loose Sand
A hypothetical but common case which involves a car wheel stuck in a rut on loose beach sand.
As we know, accelerating only digs the wheel deeper into the ground in both cases.
Saturating the sand with sea water somehow makes the sand firm enough to hold the weight of the wheel and soon enough the vehicle is freed. ->> Hydrocompaction.
This is a commonplace solution that is done almost without the thought that Soil Mechanics principles are involved.
The solutions to the foregoing case studies all have something in common, and that is a clear understanding of the behavior and physical characteristics of the soil and application of Soil Mechanics to the solution of “simple” Earthwork Problems.
As is often the case, problems such as these have occurred in the field countless times without being correctly identified and thus have resulted in significant losses to the contractor, delays in the projects and substandard quality of compacted Earthfill.
Again, it must be qualified that it is not only the contractor who is to blame but also the Consulting Engineer in most instances for this state of things. Our only consolation is that the problem is not only unique to our country but also even in more advanced Western Countries.
A vigorous search of various Soil Mechanics and Foundation Engineering Books yielded only fleeting or sporadic references to these common problems we encounter in day to day Earthwork Construction where soil mechanics principles are applied.
We however would still recommend review of various literature on the subject for those who wish to have a deeper understanding of the problem at hand particularly with the advances in the state of the Art and the State of Practice of Soil Mechanics.
8 APPLICATION OF KNOWLEDGE GAINED
However, it is not only enough to know how to select the proper compactor for the job. It is also important to use this in conjunction with our knowledge of Soil Mechanics principles which we now apply:
8.1 Sands and Clean Coarse Grained Soils
Vibratory compaction works best. However, we should aid this by liberal application of water immediately ahead of the vibratory compactor. Remember, coarse grained soils compact best at the very very wet condition “P2” or at very very dry condition “P1”. Water serves as a lubricator but its total absence also prevents capillary forces from impeding the rearrangement of soil grains into a denser packing. Speed of the vibratory compactor is also important and needs to be controlled to about 2 to 4 KPH. Vibratory frequency is also essential and should nearly approach the natural frequency of the soils. Standard frequencies are in the range of 30 to 40 cps.
The static weight of the vibratory roller is also important since the dynamic force exerted on the soil is a function of the static weight. The wheels of the roller are either ballasted by water, sand or even slag in order to increase the static mass.
Because the vibratory roller causes an “advancing wave” on the top of the lift being compacted, Field Density Testing in order to be fair has to be done below this disturbed layer. It will normally be required to scrape the top 50 cms before seating the Field Density Plate in order to be able to test the actual condition of the specific lift.
Field Density testing using the Sand Cone Method (ASTM D-1556) requires extra care since the means to measure the volume is calibrated clean sand. Any jarring motion results in increased sand intake of the test hole resulting in bigger hole volume computed than the actual resulting in low compacted densities. This condition can also be caused by compaction equipment being allowed to operate very near a Field Density test in progress.
In one project, a bull headed contractor’s foreman could not be prevailed upon to stop his operations while tests were being performed nearby. He only relented when a series of “Failing” FDT results made him realize his mistake.
Back to the subject of moisture content, for clean coarse grained sands, moisture is irrelevant except for the total absence of it or its presence at saturation levels. Thus, there is no such thing as an Optimum Moisture Content and proctor criteria are entirely inapplicable in this context.
8.2 Clays and Intermediate Soils
For Fine Grained Materials and intermediate soil types possessing significant plastic fines, sheepsfoot rollers or pneumatic tired rollers are best. The kneading action allows reorientation of the grain and allows expulsion of entrapped air.
The sheepsfoot was modeled really after the shape of a sheep’s foot perhaps based on the observations of Mr. Mc Adam. The tendency of the sheepsfoot is to walk-up by progressively compacting or densifying the lowermost layers first and walking upwards. Thus we see that topmost layers are slightly less compacted and therefore need to be bypassed when conducting a Field Density Test.
In stark contrast to clean coarse grained soils, compaction moisture content and the Proctor criteria are fully applicable and the control of moisture during compaction is a crucial factor in the attainment of proper compaction.
Static weight is also important as it increases penetration of the sheepsfoot and increases the force pressing the platelets together.
Speed is not so critical as it is the kneading action and coverage that is important.
Vibratory motion is not necessary and is in fact harmful as it can cause build up in pore pressures in the soil and also cause shear cracking.
8.3 Lahar
Since Lahar is a byword in Central Luzon and since billions will be spent in Lahar Protection Structures, using Lahar as the primary construction material, it may be worthwhile to consider this as a separate material for this paper.
Although Lahar possesses some fines, the fines are non plastic and consist of very fine ash particles.
Lahar drains easily and compacts readily as proven by river crossings which become passable as soon as the flood of Lahar subsides.
From this, we can already infer that Lahar behaves like a clean coarse grained material that it is.
Thus, Lahar is most sensitive to vibratory compaction and could compact well at very very dry or very very wet condition. Moisture control is unimportant except to see to it that either we have none of it or plenty of it during vibratory compaction.
We have done several tests on Lahar as a matter of research interest and our conclusions are as follows:
Lahar behaves as a perfectly granular material.
Lahar responds well to compaction even under ordinary vehicular loading and therefore the passage of construction traffic alone could assist compaction.
Lahar possesses high initial CBR value but some degradation in the CBR strength occurs if the sample is aged at saturation conditions (this is probably due to breakdown in the ash coating the individual grains).
Significant sulfate levels were present (at least during the initial discharge) which could impair the integrity of Portland cement concrete when this is used as fine aggregate.
We have noted that several tests have been performed by some agencies which show the all too typical bell shaped curve and therefore an Optimum Moisture Content. However, it would be noted right away that compaction started at moisture contents of 3% or greater and thus the Peak “P1” remained undetected leading to erroneous conclusions and the unnecessary imposition of an Optimum Field Moisture Content.
9 CONCLUSIONS
The purpose of this paper would have been already truly served if the construction industry would start to recognize the differences in behavior between coarse grained and fine grained materials through the use of sound fundamental Soil Mechanics principles rather than from “feel” or guess work.
Often times, these fail in the actual field situation and the simple task of Earth Compaction becomes a costly and heartbreaking exercise.
1] Principal EM2 A Partners & Co., MS in Civil Engineering, Carnegie Mellon University, Pittsburgh Pa., Fellow PICE, ASEP and ASCE. PhD Candidate Asian Institute of Technology, Bangkok Thailand, Formerly Senior Lecturer, UP Graduate Division, School of Civil Engineering, Diliman. BSCE Mapua Institute of Technology, Manila, Chairman Geotechnical Specialty Division PICE/ASEP, Chairman National Structural Code of the Philippine 2010 update committee.
The threat of Soil Liquefaction is all too real and the damage wrought to Dagupan City and other areas due to liquefaction during the 1990 Luzon Earthquake indicate the need to provide engineered responses to mitigate or eliminate the threat.
With the anticipated build up in private infrastructure and development, the availability of cheap land is becoming scarcer and scarcer and therefore, focus is being directed into the development of marginal lands which invariably would involve some risks due to potential for liquefaction and other geotechnical concerns.
Particularly in the Philippines which is in a very active Seismic Zone, with very long coastlines with marine sedimentary deposits and inland alluvial valley deposits, potentially liquefiable loose to very loose granular soil deposits are prevalent.
This paper discusses the phenomenon of soil liquefaction, the causative mechanisms and the “State of the Art” approaches to determining liquefaction susceptibility of a specific soil deposit and the factor of safety.
This is followed by current “State of Practice” discussion addressing anti-liquefaction counter measures and mitigation methodologies available to engineers and developers.
1.0 INTRODUCTION
1.1 GENERAL
Soil liquefaction is a sudden loss in strength in loose to very loose saturated granular soils due to ground shaking followed by a rapid increase in pore pressure. The ground shaking, which is normally due to earthquakes or significant horizontal shearing and excitation of the loose to very loose soils, momentarily causes dislodgement of the precarious grain to grain contact of the individual soil grains.
A different phenomenon on soft to very soft cohesive soils, which has been wrongly attributed as soil liquefaction in the past, is another mechanism caused by repeated cyclic shearing of the soils. Particularly in very sensitive soils, the cyclic disturbance causes a significant loss in shear strength which could result in instability or bearing capacity failures. This second phenomenon is not addressed in this paper as it is a totally different failure mechanism with the same causative or triggering events.
Rapid increases in porewater pressure normally accompany this ground shaking. Due to the dislodgement, the superimposed weight on the ground is momentarily transferred to the porewater because the soil loses its strength due to loss of grain to grain contact. This momentary transfer further increases the porewater pressure in the saturated zone further buoying up the already dislodged soil grains. Buoyancy causes the total collapse of the soil structure resulting in a “liquefied mass” which does not possess any shear strength or load carrying capacity.
Thus, the loads (structures) imposed on the soil before the liquefaction which originally was deemed “stable” momentarily loses the soil support leading to partial collapse or tilting to total collapse.
The following effects of Liquefaction can occur in a vulnerable site when liquefaction is induced by significant ground shaking:
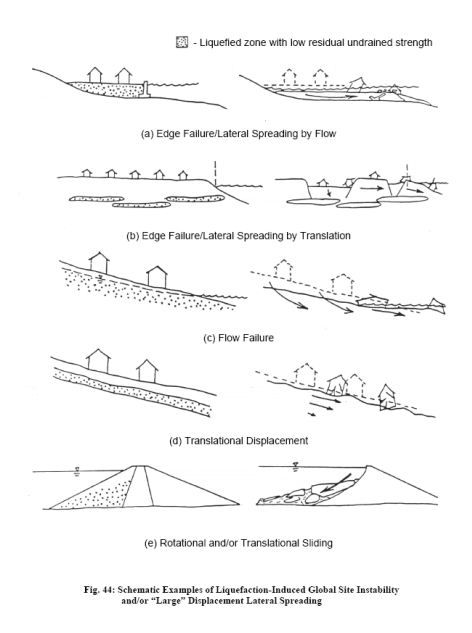
Lateral Spreading from Liquefaction. Lateral deformation induced by earthquakes is discussed below.
Lateral Deformation. The occurrence of liquefaction and its associated loss of soil strength can cause large horizontal deformations. These deformations may cause failure of buildings, sever pipelines, buckle bridges, and topple retaining walls.
Three types of ground failure are possible. Flow failures may occur on steep slopes. Lateral spread may occur on gentle slopes.
Figure 1.1 Examples of Lateral spreading due to Liquefaction. 3]
The third type of failure involves ground oscillation on flat ground with liquefaction at depth decoupling surface layers. This decoupling allows rather large transient ground oscillation or ground waves.3]
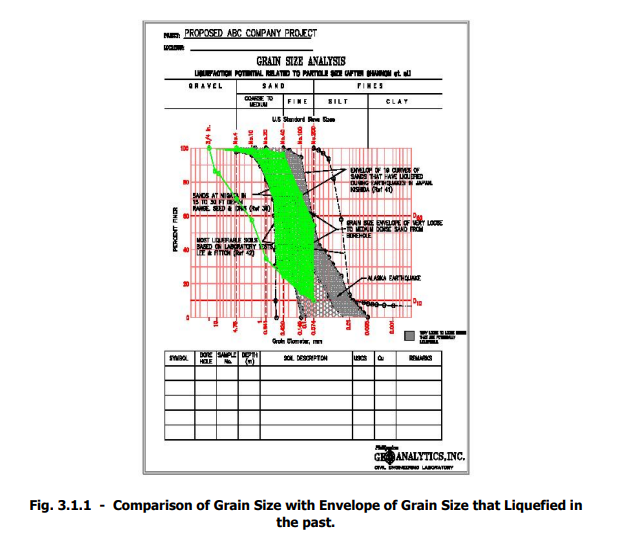
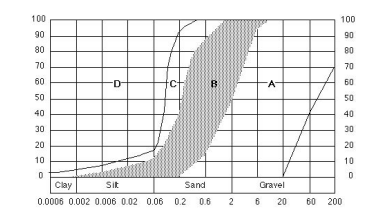
In the past, as in the present, empirical and semi-empirical methods have been used in order to assess the liquefaction susceptibility of a site. This ranged from the use of comparison charts of characteristic grain size envelopes of sites worldwide that have liquefied in the past (see Figure 3.1.1.) on which the characteristic grain size of a specific site is superimposed, the use of rule of thumb checks, to the development of the Cyclic Resistance ratio (CRR). Even in the latter procedure, which is now universally accepted, recent developments in the understanding of liquefaction has resulted in significant changes in our understanding of this phenomenon in soils, its assessment as well as the feasible countermeasures to mitigate or reduce the effects on civil engineering structures.
It is the purpose of this paper to look into possible liquefaction mitigation technologies and discuss their effectiveness.
2.0 BACKGROUND ON LIQUEFACTION
Liquefaction is sudden loss of soil strength due to flotation of the individual soil grains from excess pore pressure and ground shaking during an earthquake.
However, before Liquefaction can occur the following conditions need to be satisfied which according to Seed 4] are:
Soil-type – Soils with 50% or more of their grain size in the range of 0.02mm to 0.2mm are potentially liquefiable when saturated.
Intensity of Ground Pressure – To initiate liquefaction local ground acceleration greater than 0.10g is required.
Initial Confining Pressure – The stress required to initiate liquefaction increases with confining pressure.
Duration of shaking – It is necessary for the shaking to continue for some time (a characteristic of large earthquakes).
Liquefaction associated failure may be of the following types:
Tilting due to instability
Direct settlement due to loss of bearing capacity
Uplift due to buoyancy effects
Translation of structure
3.0 LIQUEFACTION ASSESSMENT
Most of the discussions in this Section were lifted from a “State of the Art” paper by Seed et al5]
3.1 Analysis of Liquefaction
3.1.1 Empirical Correlations
Empirical correlations were based essentially on comparison of Grain size distribution of the site to the grain size envelope of sites that have liquefied in the past worldwide. This follows the work of Nishida, Fitton and others as well as recorded liquefaction at Turnagain Heights in Alaska.
If the grain sizes of the target site fall within the envelope of grain sizes that have liquefied in the past, then most likely the site will also experience liquefaction given an earthquake large enough to cause shearing and dislodgement of the loose to very loose sands.
A sample of this procedure is shown below and is used still to gage susceptibility to liquefaction in conjunction with other methods.
3.1.2 The “Simplified Procedure” by Seed and Idriss
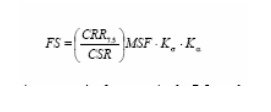
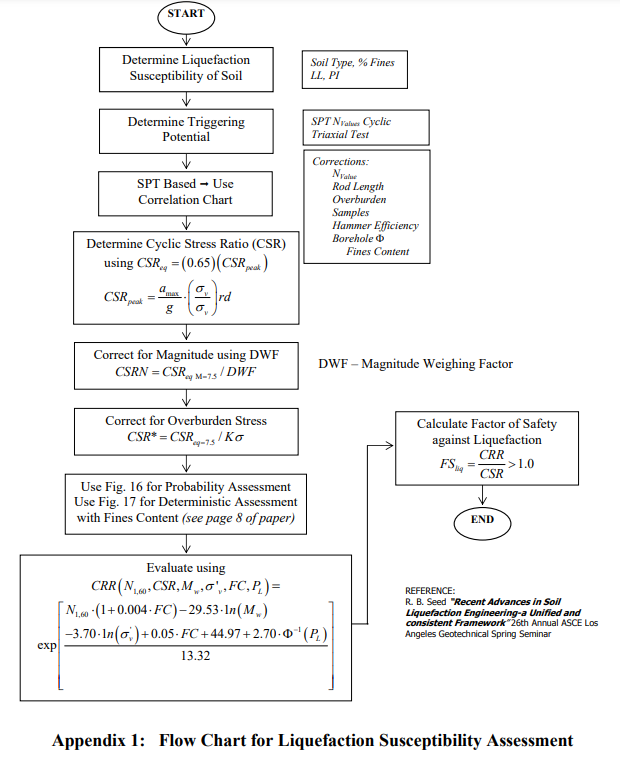
Analytical Evaluation of liquefaction potential of a site is based originally on the pioneering work by H Bolton Seed and Idriss (1971) The “simplified procedure” originally developed involves the calculation of the Factor of Safety obtained by determining the Cyclic Resistance Ratio and Cyclic Stress Ratio of the site soils. The method has been modified and improved by several researchers. The current “simplified procedure” calculates the factor of safety, FS, against liquefaction in terms of the cyclic stress ratio, CSR (the demand), and the cyclic resistance ratio, CRR (the capacity), according to the formula:
where:
CRR7.5 is the cyclic resistance ratio for magnitude 7.5 earthquakes, MSF is the Magnitude scaling factor, Kσ is the overburden correction factor, and Kα is the correction factor for sloping ground.
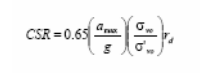
CSR is estimated using the Seed and Idriss (1971) equation multiplied by 0.65:
where: amax is the peak horizontal acceleration at the ground surface generated by the Earthquake,
g is acceleration due to gravity,
σvo and σ’vo are the total and effective overburden stresses, respectively, and
rd is the stress reduction coefficient.
Other than the purely empirical grain size comparisons, the three commonly used methods to evaluate the liquefaction resistance, CRR, Gutierrez Ref 6] are:
Using the Standard Penetration Test (SPT),
Using the Cone Penetration Test (CPT), and 3) Using Seismic Shear wave velocity
Associated uncertainties in the development of probabilistic methods for liquefaction risk analysis based on the “simplified” method are:
the uncertainty in demand particularly the maximum acceleration amax and the earthquake magnitude Mw , required to estimate the magnitude scaling Factor MSF and
the uncertainty in the capacity CRR . For CRR, the uncertainties are due to natural variability of the soil and geotechnical properties, in-situ testing procedures, and most importantly the simplified method. Gutierrez 4]
Recent researches into this field have resulted in further refinements in the procedure particularly in both the “deterministic” and “Probabilistic” determination of liquefaction potential.
In a recent groundbreaking publication by Raymond Seed et al known as the Queen Mary Paper,” ref3] refinements in the procedure over that of the “simplified” Seed (Senior) procedure have been proposed.
New models presented and described in this specific research paper deal explicitly with the issues of:
Fines content (FC),
magnitude-correlated duration weighting factors (DWFM), and
Effective overburden stress (Kσ effects), and they provide both
An unbiased basis for evaluation of liquefaction initiation hazard, and
Significantly reduced overall model uncertainty.
3.1.3. Influence of Fines Content and Plasticity
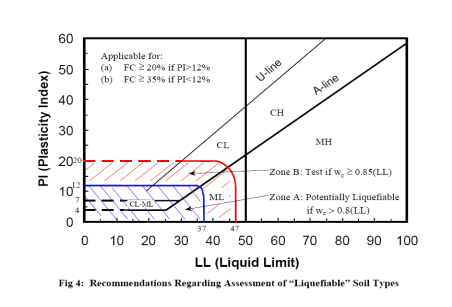
The fines content (% passing No 200 sieve), more specifically Plasticity of these fractions greatly influences the susceptibility to liquefaction. The chart below is the recommendation from the paper by Seed et al 3] regarding the influence of the fines content, more specifically the effects of its Liquid Limit LL and Plasticity Index PI on the liquefiability of soils.
For soils with sufficient fines content that the Fines separate the coarser particles and control overall behavior:
⦁ Soils within Zone A are considered potentially susceptible to “classic” Cyclically induced liquefaction, ⦁ Soils within Zone B may be Liquefiable, and ⦁ Soils in Zone C (not within Zones A or B) are not generally susceptible to “classic” cyclic liquefaction, but should be checked for potential sensitivity (loss of strength with remolding or monotonic accumulation of shear deformation).
It has been found out that for soils with sufficient fines content FC, the characteristics of the fine fractions greatly influences susceptibility to cyclically induced Liquefaction.
Both the probabilistic and “deterministic” (based on PL=20%) new correlations presented in Figures 10 and 11 are based on the correction of “equivalent uniform cyclic stress ratio” (CSReq) for duration (or number of equivalent cycles) to CSRN, representing the equivalent CSR for a duration typical of an “average” event of MW = 7.5. This was done by means of a magnitude- correlated duration weighting factor (DWFM) as:
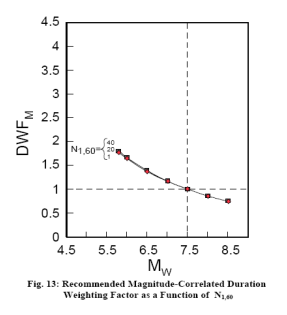
This duration weighting factor has been somewhat controversial, and has been developed by a variety of different approaches (using cyclic laboratory testing and/or field case history data) by a number of investigators.
The Chart below shows the Duration Weighting Factor DWFm with a value of 1.0 for an earthquake Magnitude of 7.5. Thus for M > 7.5 the DWFm is less than 1.0 resulting in a higher CSRN in equation (a) above.
3.1.5 SPT Based Triggering Correlations
One of the more important contributions of the Queen Mary Paper is in the improvement of the SPT based correlations which has reduced the uncertainty in the use of such charts in the past. For one, Key elements in the development of this new correlation were:
Accumulation of a significantly expanded database of field performance case histories,
Use of improved knowledge and understanding of factors affecting interpretation of SPT data,
Incorporation of improved understanding of factors affecting site-specific ground motions (including directivity effects, site-specific response, etc.),
Use of improved methods for assessment of in-situ cyclic shear stress ratio (CSR),
Screening of field data case histories on a quality/uncertainty basis, and
Use of higher-order probabilistic tools (Bayesian Updating).
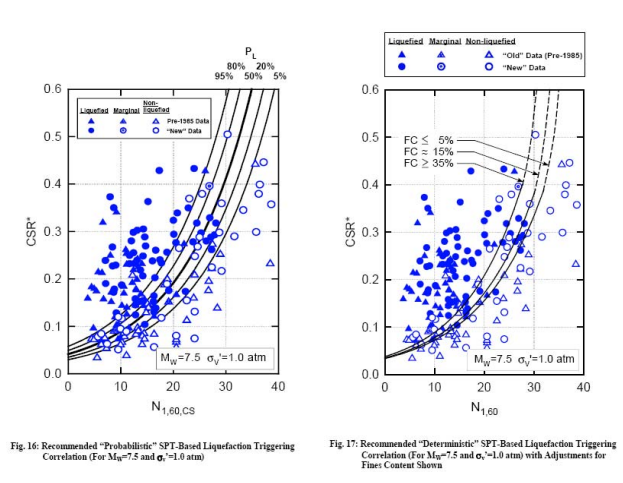
The charts below are the recommended procedure for determining Probabilistic and Deterministic Cyclic Stress Ratio (CSR) from the corrected and normalized SPT Nvalues. The probabilistic chart shows a family of curves based on Probability values (PL), while for the Deterministic Chart; the family of lines represents different Fines content (FC) values. The solid data points represent correlated “liquefied” zones while the unshaded data points represent sites that have not liquefied.
However, before these could be applied, corrections on the SPT values need to be made as follows:
⦁ Correction for Hammer Energy ⦁ Correction for Rod Length ⦁ Correction for Overburden stress ⦁ Procedural corrections
The discussion of the foregoing effects is outside the scope of this paper. However, the reader is referred to the paper by Seed et al 5].
4.0 LIQUEFACTION COUNTERMEASURES AND MITIGATION OF EFFECTS
4.1 GENERAL
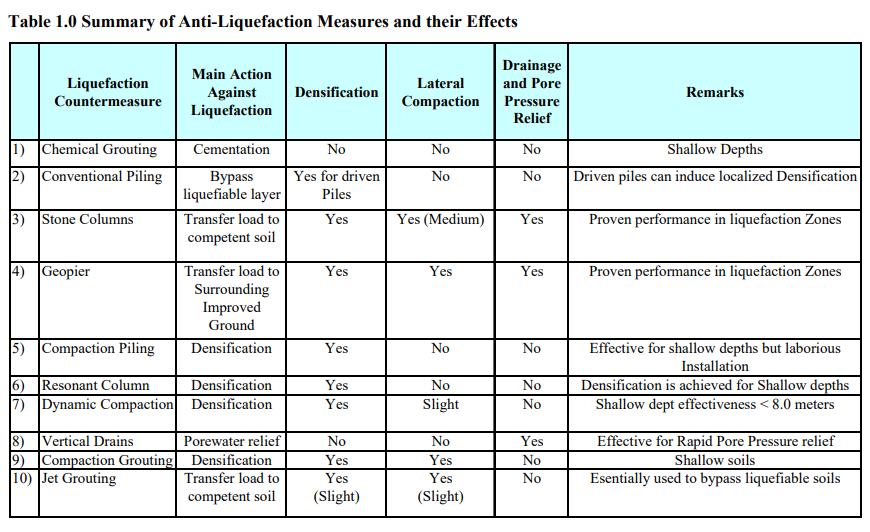
There are several procedures to mitigate or eliminate the harmful effects of liquefaction ranging from hard responses to simple avoidance. These are:
Site Selection – Potentially liquefiable areas can be identified and avoided. However, as premium lands become scarcer, marginal lands become attractive and thus this solution may not be commercially acceptable to developers.
Use of piling to bypass the potentially liquefiable zones. This is the brute force solution. Piling would need to be designed for the unsupported length equivalent to the liquefied depth and for potential negative skin friction from clay layers overlying liquefiable zones. Detailing would also be under Seismic Zone 4 Conditions.
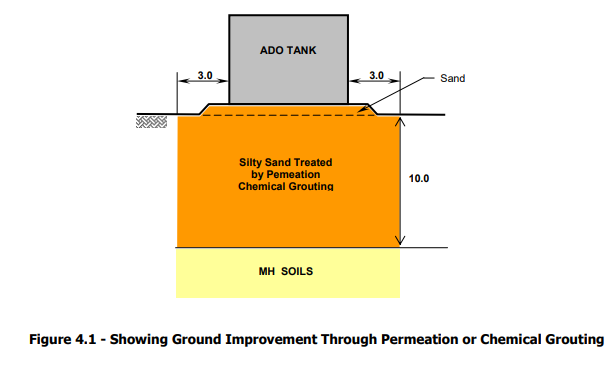
Chemical or Cement Injection grouting to solidify the liquefiable soils . The permeability of the target soils should be determined to assure proper grout dispersion. Injection points may be numerous as grouting pressure can not be boosted or hydro fracturing can result.
Joosten 2 Part Process
Portland cement Injection.
However, the State of Practice has evolved through the years, to make available cost effective liquefaction mitigation technologies that could be effectively used in countering liquefaction or in preventing the build-up of the critical conditions before set up of liquefaction.
Among these are:
Ground Densification – The liquefiable loose to very loose grounds can be densified to the desired density to eliminate its susceptibility to liquefaction.
Compaction Grouting – is defined as the staged injection of low slump (less than 3 inches) mortar-type grout into soils at high pressures (500 to 600 pounds per square inch), is used to densify loose granular soils. At each grout location a casing is drilled to the bottom of a previously specified soil target zone. Compaction grout is then pumped into the casing at increments of one lineal foot. When previously determined criteria are met such as volume, pressure, and heave, pumping will be terminated and the casing will be withdrawn. The casing will be continuously withdrawn by one foot when it meets previously determined criteria until the hole is filled. 3]
4.2 Ground Improvement Procedures
4.2.1 Strength Increase of Loose Sand Deposits with Vibratory Densification Procedures
Ground Densification procedures have the beneficial effect of improving the ground through densification and also through reinforcement of very poor clayey soils and to some extent in the acceleration of the consolidation process through radial drainage into the permeable granular columns. In addition, the densified granular columns serve to carry the major part of the load because of its relatively very high stiffness compared to the surrounding matrix soil.
The strength gain of the soil with time is also one of the beneficial effects.
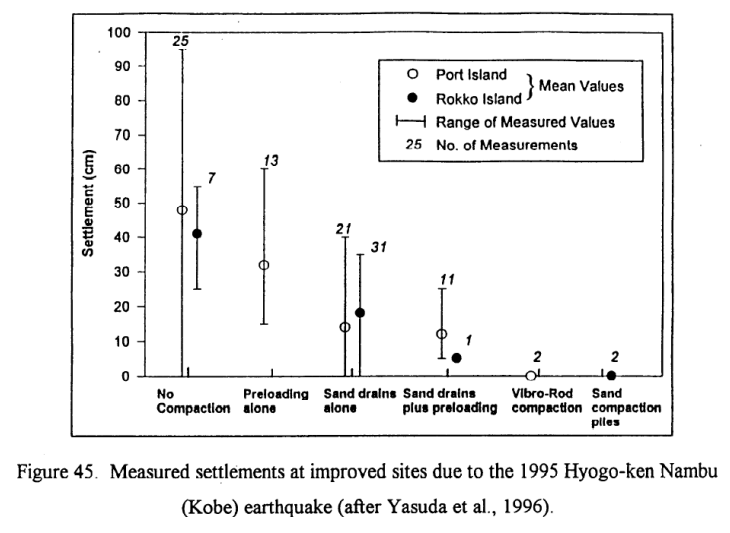
In addition, performance of granular piles in the Hyogen-Nambu (Kobe) Earthquake has shown that areas improved with Granular piles did not fail during the liquefaction event, whereas surrounding areas that were not improved showed significant damage and collapse of structures. In this case, the granular piles serve as Chimney drains to relieve the pore pressures.
But of more critical importance is the almost immediate strength gain through reinforcement of the weak subsoils by densified columnar elements. The failure plane or the slip circle has to pass through and cut through the relatively very dense granular materials before it can propagate any further. In effect, the factor of safety is enhanced by the reinforcing effect of the Granular columns with large Angle of internal friction.
4.2.2 Generic and Proprietary Ground Densification using Vibratory Method
4.2.2.1 Compaction Piling/Resonant Column
Compaction piling, using steel rigid steel retractable mandrels, are driven at regular intervals or spacing in triangular or square array, within the liquefiable soils. The mandrel is then withdrawn and the hole is backfilled with sand. The mandrel is then redriven and retracted until full treatment depth has been completed.
4.2.2.2 Resonant Column Apparatus
This is a proprietary German technology which drives a steel probe attached to a vibratory equipment which induces vibration through the probe. The vibrating frequency is chosen at or near the Resonant Frequency of the soil to be densified. Thus, resonance builds up and the loose soils vibrate in themselves causing a denser packing to be achieved. The target density or Nvalue is controlled through the spacing of the insertion of the probe.
4.2.2.3 Dynamic Compaction
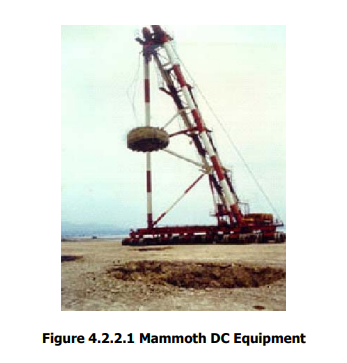
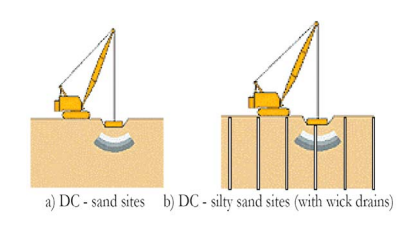
Dynamic compaction, developed by the late Louis Menard and originally marketed as Dynamic consolidation became popular in the seventies. The procedure involves the dropping of a heavy tamping weight over a free fall height of greater than 10 meters in order to cause shock waves The effective depth of treatment depends on the energy of the falling weight as it impacts on the ground. Empirically, the effective depth De of treatment is given as:
De = f √ W*H
where:
D=Effective depth of Treatment ft
f= a constant depending on the soil (normally ½ )
W=Impact weight kips
H=freefall height
In order to avoid impact energy losses, a single line crane must be used to lift the weight. Thus, relatively heavy lift capacity cranes are needed to lift the weight due to lack of mechanical advantage derived from multiple pulley systems.
The depth of treatment based on the largest system ever built, is approximately 8.0 meters. Beyond this depth, energy from the surface is dissipated resulting in significantly reduced compaction.
Several drops are needed to finish one location with the interval between drops governed by the pore pressure dissipation.
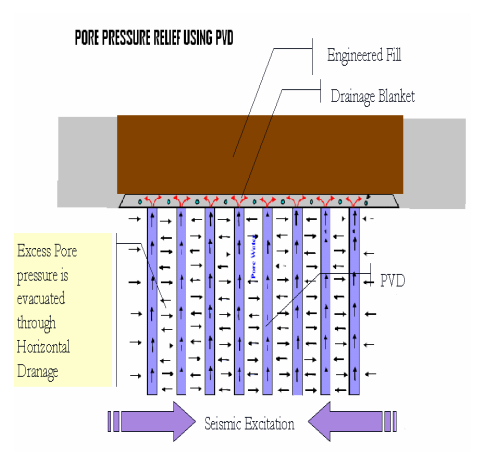
Treatment procedures 7] would be different for various types of soils. PVD’s would need to be installed in clays and impermeable soils to aid in drainage and rapid pore pressure decay.
4.2.2.4 GEOPIER Impact Piers®
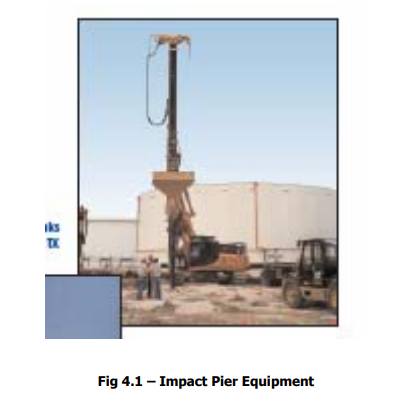
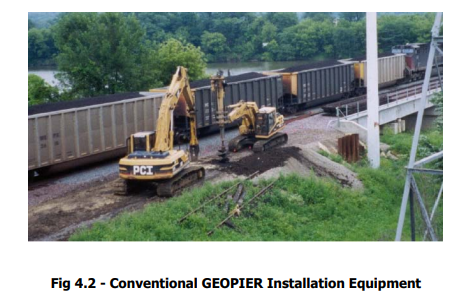
The Impact Pier® is a Proprietary Technology developed by Geopier Corporation 8] similar to stone columns in some respects but achieving higher aggregate column stiffness due to the patented beveled tamper foot. The Impact System uses vertical displacement Rammed Aggregate Piers (RAPs) to reinforce good to poor soils, including loose sands, silts, mixed soil layers including clays, uncontrolled fill and soils below the ground water table.
The installation process displaces soil during installation and utilizes vertical impact ramming energy to construct vertical displacement RAPs, which exhibit high strength and stiffness. The RAP procedure is designed to provide total and differential settlement control and increase bearing support.
The cavity is created to full depth by pushing a specially designed mandrel and tamper foot using a relatively large static force augmented by dynamic impact energy. This method eliminates spoils as all penetrated spoils are displaced laterally. A sacrificial cap prevents soil from entering the tamper foot and mandrel.
After driving to design depth, the hollow mandrel serves as a funnel for the placement of aggregate. The aggregate is placed inside the mandrel and the mandrel is lifted, leaving the sacrificial cap at the bottom of the pier. The tamper foot is lifted approximately three feet and then driven back down two feet, forming a one-foot thick compacted lift. Compaction is achieved through static force and dynamic impact energy from the hammer.
The Impact hammer blows densify aggregate vertically and the patented 45° beveled tamper foot forces aggregate laterally into cavity sidewalls. This results in effective coupling with surrounding soils and Settlement control and strength and stiffness. The lateral compactive energy results in prestressing and Prestraining the matrix soil.
The RAP can develop Friction Angles of 42 to 48 depending on the aggregate and confining matrix soil.
4.2.2.5 Vibrodensification or Vibroflotation®
Vibrodensification using proprietary technologies consists of introducing a rigid vibratory steel mandrel into the granular soil to be densified by vibratory excitation. This method is used primarily for densifying clean granular Cohesionless soils. The action of the vibrator usually used in conjunction with water jetting momentarily reduces the intergranular friction of the loose sand grains causing these to assume a denser state due to vibratory excitation. Granular material (sands and gravels) is dropped down the annular cavity between the mandrel and soil.
However, care must be used in order to prevent uplift or heaving of previously installed columns.
The granular materials are dropped and vibrated by a vibratory hammer. The resulting vibration results in densification of the coarse grained materials and the surrounding loose sand layers. Although the surrounding very soft clays would not generally densify, the densified sand columns will act as vertical reinforcement to increase the composite shear strength of the sub seabed clay soils. In addition, the sand columns will serve as vertical drains to accelerate the consolidation process by reducing drainage paths and providing for increased pore pressures momentarily during installation as to accelerate the drainage process further.
The accelerated consolidation will also allow for the accelerated development of increased shear strengths. In thick very poor cohesive soils, Vibroflotation may not be as effective as bulging of the vibroflot pile may result. This should be avoided as significant load reduction due to bulging could occur.
Vibroflotation operates effectively within a certain Grain Size Envelope as shown below:
Vibro replacement or Stone columns, uses columns of dense crushed rocks which are dropped into the cavity and incrementally densified by two horizontal counter rotating eccentric weights, that imparts vibratory excitation to the surrounding granular materials causing increased densification and thus reducing liquefaction susceptibility. The effectiveness of treatment depends on the c-to-c spacing of the densified granular columns. Usually this is done in triangular pattern.
Stone columns extend the use of deep vibratory process to even cohesive soils such as clays and silts. The stiff stone column reinforces the soil matrix and also increases the composite strength of the soil.
The stone columns reduce foundation settlement, enhance bearing capacity and more importantly reduce Liquefaction Potential.
Care must be used in order to prevent uplift or heaving of previously installed columns particularly in very poor cohesive soils.
4.2.3 Pore water Relief
Of very great importance is the recognition that porewater pressure relief through the use of vertical drainage materials will assist in preventing the set up of pore pressures to cause liquefaction.
Documented evidence during the Hyogen-Nambu (Kobe) Earthquake showed that Port works where granular piles were installed did not liquefy in stark contrast to adjacent failed structures where no granular piles were installed.
The granular piles acted as chimney drains in which the pore pressure was dissipated through rapid drainage into the highly permeable granular columns.
Thus, in this specific case, vertical drainage in the form of Granular piles, Geopiers, prefabricated vertical drains, or sausage drains can be deployed to prevent liquefaction initiation.
Of the foregoing, the use of granular piles and prefabricated vertical drains (PVD) hold prominence as a liquefaction countermeasure.
Figure 4.2.3.1 – Showing PVD InstallationFigure 4.2.3.2 – Showing Pore pressure relief in Liquefiable soil using PVD
4.2.4 Compaction Grouting
Compaction grouting using cement injected at high pressures incrementally can assist in densifying the poor granular soils. The cement slurry is injected under high pressure to form spherical bulbs of slurry expanding into the soil. This expansion would cause lateral stressing of the soil. However, the influence of the expanding grout is limited requiring numerous elements to be installed.
Similar to compaction grouting but different in installation procedure and effect is achieved using Jet Grouting.
Jet grouting involves the creation of large diameter columnar soil cement piles known as “Soilcrete” to bypass the liquefiable or poor soils and also induced lateral compaction of the surrounding ground to a limited extent. The main advantage is significantly larger loads can be carried and transferred to more competent ground thus bypassing the potentially liquefiable soils.
4.2.5 Use of Explosives “Camouflet”
Explosives have been used in the American Civil War in order to either collapse enemy tunnels or introduce shock waves and gases into the tunnel.
In Civil Engineering, camouflets were used specifically by the Russians to densify Loessial soils and loose to very loose sands. The spherical shock wave after the explosion creates an instantaneous cavity after expansion which then collapses in itself thus densifying the ground.
It would be necessary to drill a hole sufficiently deep enough for the overburden thickness not to be lifted bodily by the explosion.
Once initiated, the area subjected to the explosion is densified by a series of well placed explosives. The explosion is most effective under saturated soil conditions.
5.0 RESEARCHES ON LIQUEFACTION MITIGATION
A lot more need to be understood regarding the liquefaction phenomenon. Research in this field is continuing particularly in the areas of post liquefaction residual strength prediction as well as prediction of settlements induced by liquefaction.
5.1 Post Liquefaction Prediction of Volumetric Reconsolidation
The prediction of settlements or volumetric changes after the triggering of liquefaction, needs to be quantified or estimated.
The work by Cetin et al 2002 is a step towards this direction.
The horizontal axis of the Figure above represents fines-adjusted, and normalized SPT penetration resistance, using the same fines corrections that were employed previously in the new “triggering” relationships. The vertical axis represents equivalent uniform cyclic stress ratio adjusted for: (1) magnitude-correlated duration weighting (DWFM), and (2) effective overburden Stress (Kσ). In using this figure, the earthquake-induced CSReq must be scaled by both DWFM and Kσ.
To estimate expected site settlements due to volumetric reconsolidation, the recommended procedure is to simply divide the subsurface soils into a series of sub-layers, and then to characterize each sub-layer using SPT data. Volumetric contraction (vertical strain in “at-rest” or K0 conditions) for each sub-layer is then simply summed to result in total site settlements.
5.2 Post Liquefaction Prediction of Residual Strength Su r
Corollary with the need to predict Post liquefaction volumetric changes is the need to predict residual strengths after a liquefaction event has occurred.. Seed and Harder 1990 have come out with recommendations relating SPT Nvalue N1, 60 with the mobilized undrained critical Strength S u r .
Prediction of the residual strength is important in determining whether the insitu residual strength could result in a catastrophic event due to the significant weakening of the liquefied ground.
6.0 CONCLUSIONS
The foregoing has presented current “state of practice” in Liquefaction assessment and has presented the available anti-liquefaction measures that could be mobilized by the engineering professions.
Most of the information has been culled from literature reviews by the authors and also from combined experiences.
The state of the art in the understanding of the Liquefaction Phenomenon is still evolving and can be considered a “work in Progress” by various researchers worldwide.
More work needs to be done in order to fully understand Liquefaction and how to mitigate or eliminate its effects.
1] MSCE major in Geotechnics and Structures, Carnegie Mellon University, Pittsburgh, PA., Chairman, PICE Geotechnical Specialty Division., Principal, EM2A Partners & Co.
2] M.Sc. Master of Science major in Earthquake Geotechnical Engineering, University of California – Berkeley, CA. Managing Director , Philippine GEOANALYTICS Inc.
contact : www.pgatech.com.ph
3] US DOD NAVFAC DM 7.4 “Soil Dynamics and Special Design Aspects”
4] Seed & Idriss:” Simplified Procedure for Evaluating Soil Liquefaction Potential” Journal of ASCE SM9 September 1971.
5] R. B. Seed “Recent Advances in Soil Liquefaction Engineering-a Unified and consistent Framework” 26th Annual ASCE Los Angeles Geotechnical Spring Seminar.
6] M. Gutierrez, J. M. Duncan, C. Woods and M. Eddy “ Development of a Simplified Reliability-Based Method for Liquefaction Evaluation” Civil and Environmental Engineering Virginia Polytechnic Institute & State University
7] Nashed, R. “ A Design Procedure for Liquefaction Mitigation of Silty Soils using Dynamic Compaction”
By Emilio M. Morales, MSCE 1 and Joselito Emmanuel J. Cruz, CE 2
ABSTRACT: Oftentimes, the Consulting Engineer is confronted with Materials Test Results from which he has to make judgments that would have a potentially large impact on the Project’s cost, schedule, quality or safety. The decisions made depend to a large extent on the Engineer’s knowledge and familiarity with the test procedures, test limitations, significance of the test parameters as it affects his design, the acceptance criteria and material behavior under load or in differing environments. In the strength testing of rebars for example, higher yield stresses during test do not necessarily mean better as other test information/parameters need to be evaluated or before acceptance or conclusions could be made. In the testing of concrete, several failures in a batch of cylinders do not necessarily mean that the batch should be condemned as the statistics need to be evaluated before such a drastic action is even contemplated. In the compaction of soils, excessive compaction leads to breakdown and degradation of the Soil Fabric contrary to ordinary laymen’s expectations “That the more you pound, the harder the ground.” The Engineer should therefore be equipped with adequate knowledge and understanding of the test procedures material properties and material behavior in order to make intelligent and “Informed” judgment calls Engineering Judgment in its truest sense. This paper hopes to open the way to a greater understanding of this important aspect of our day to day practice of the profession in the real world.
1.0 INTRODUCTION
In the Building Industry, “Stronger” has always been synonymous to “Better”. This has been manifested in, and reinforced by, common beliefs due to the survival of archeological structures which because they were Built “Strong”, have actually survived. However, most of these ancient structures have survived through sheer massiveness and more than liberal use of materials such as masonry blocks and mortar. Nevertheless, not even all of these have survived the ravages of Earthquakes in our country. Even those which have survived show scars or damage due to Earthquakes.
It is disheartening to note that this mistaken belief has creeped into our present day practice and most of the time Stronger, Harder, Bigger, Stiffer, etc., have always been Better !
Alas, present day knowledge of material behavior and performance as borne out by Laboratory Tests simulating actual service loading under Earthquake or other conditions have shown that Stronger is not always Better !
This paper hopes to highlight some fallacies in the Design of structures, be it Buildings, Roads or Dams which tended to overdesign or increased strengths by choice or by accident.
In some instances, as we shall find out later on in this paper, higher strengths could lead to bigger problems and may surprisingly at times trigger an earlier failure in our structure than if the structure were purposely made “Weaker”.
Of significance in this discussion is the appreciation of the Test Parameters and results of Laboratory Tests on Civil
Engineering Materials. A clearer understanding of the test results allows the Designer and Consulting Engineer to render proper judgment calls and Engineered Decisions that are supported by the material’s characteristic behavior and the limits imposed by Code or by Standards of Practice and its behavior under loads.
We shall discuss these very important considerations and the role that testing plays for:
Reinforcing Bars
Concrete
Structural Steel
Soils
Sometimes, Design Engineers accept materials substitution without understanding its characteristic behavior. This could lead to objectionable or dangerous consequences.
This is what we are going to find out in order to support the statement “Stronger is not necessarily better”.
First, let us try to understand what happens to Reinforced Concrete under severe Seismic Loading conditions.
In order to do so, we have to go to our Basic Fundamentals of Concrete Design which we summarize:
In Reinforced Concrete design, we were taught that it is desirable to attain a reinforcement ratio that is below Pb or balanced reinforcement (0.75 Pb). This is to ensure that yielding or failure is initiated first on the steel ahead of the concrete compression block to avoid an explosive, Brittle and sudden failure.
Under seismic loading, ductility plays a very important role for both concrete and steel structures. Ductility is critically important in RC Structures under Zone 4 for several reasons:
We would like to prevent sudden failures or collapse without warning.
Initial yielding or plastic hinging has to be initiated at an early stage under severe seismic loads to allow dissipation of energy. Failure to do so build ups larger inertia forces that need to be absorbed by the structure thus causing more severe damage or sudden collapse.
Design under severe Earthquake loadings requires that total collapse does not ensue although the serviceability may be impaired to a point beyond practical repair.
This brings us to focus on just what is necessarily needed to satisfy the foregoing fundamental requirements.
Very critical to this is that yielding is initiated at an early stage where it was assumed by the Designer in compliance with the code for Seismic Design. This can only happen if the Yield Stress is low – (Not Stronger!) but still satisfying the design Yield Stress (YS) specified in the Code and used by the Designer.
Why is this important ?
Postponing the yield as we have said increases inertia forces which the structure has to absorb.
But more important, if yield does not occur at the design yield, Bond and Shear stresses reach critical levels earlier, thus initiating a sudden failure in the structure by Brittle Behavior.
If in addition to this, the Yield Stress approaches the Ultimate Tensile Stress very closely (reduced yield region). Gradual formation of Plastic Hinges is aborted and ultimate strength is reached causing sudden collapse.
A measure of how far apart is the Yield Stress and the Tensile Stress – the TS/YS ratio, is a measure of the ability of the structure to undergo inelastic rotation and absorb energy and dissipate it by deformation or yielding. As the structure loses its stiffness in response to a strong ground motion, its capability to dissipate energy increases. These tend to reduce the response acceleration or lateral inertia forces that develop during deformation of the structure.
The ACI Code & PNS 49 both call for a TS/YS ratio of 1.25.
This sets the minimum distance between the yield and tensile stresses for obvious reasons – To allow sufficient time to develop plastic rotation and promote energy dissipation before collapse is induced.
Implicit in all these is there is a need to impose a ceiling on the yield stress to the level assumed in the design. Thus, it is a fallacy and highly erroneous to accept higher yield strength rebars because they are stronger, in total disregard of the design assumptions !
“Because Stronger is not necessarily better!”
As a specific example, sometimes we encounter situations where the Engineer blindly accepts substitution of Higher Grade Rebars (As when he specifies grade 40 and then accepts substitution by grade 60 without any qualifications) than what he or she used in the design in total ignorance of the need to limit the yield stress.
To compound this, unscrupulous suppliers try to pass on Non Standard rebars or Non Approved Rebars that have significantly very high yield stresses very much closer to the Tensile Stress (A reduced yield region), a TS/YS ratio approaching unity. Therefore inelastic rotation is relatively short and failure ultimately ensues.
Therefore, we can conclude that “Stronger is not necessarily better”.
In another vein, very high tensile (and yield stress) lead to Brittle Failure mode as the materials really are brittle. But this is another story.
In addition to controlling rebar strengths, the reinforcement ratio Pb should also be controlled both ways.
In seismic design, the two extremes are critical. It is necessary that the reinforcement ratio be controlled:
By setting minimum limits to the reinforcement ratio 200 bwd/fy
By setting maximum limits = 0.75 Pb.
There are compelling reasons for the above requirements.
It would not be advisable to severely under reinforce the RC Structural element because the cracking moment Mc would be reached first rather than the yield moment.
In the first instance, a single crack development would cause a sudden catastrophic collapse because gradual yielding and straining is not possible.
In the other extreme, over reinforcement beyond the balanced reinforcement requirement “Pb” initiates early overstress in the concrete compression block rather than allowing gradual yielding accompanied in the rebar by gradual deflections which provides ample warning to the occupants unlike a compression type failure which is essentially explosive and sudden.
Therefore, “Stronger is not better”
Lest we are lulled into generalizations, we also add another admonition:
“Less (weaker) is also not better”
ACI 318 thus imposes the following restrictions for seismic design in .R.C as follows:
2.0 REBARS
Tests on rebars is guided by Philippine National Standards (PNS) PNS-49:1991 “Steel Bars for Concrete Reinforcement -Specification” by the Bureau of Product Standards covering the following grades of steel rebars:
Grade 230 For both Weldable, 275 and non weldable, 415 hot rolled steel rebars
Looking at the table, it is interesting to note that the requirement for TS/YS ratio (As indicated by **) only applies to Grade 415 Weldable Steel whereas ACI 318 and its commentary is very explicit that the TS/YS ratio should be 1.25 without exception or qualification as to rebar type for Seismic Design.
Thus, there is a real need to amend PNS 49-1991, to amend the Table so as to cover all Rebar Grades and Types (Weldable and Non Weldable to ensure adequate performance in a High Seismic risk location) and thus comply with the ACI Code and the NSCP.
* Yield strength maximum of weldable deformed or plain steel bar = 540 MPa ‡ ** Tensile strength shall not be less than 1.25 times the actual yield strength.
+Plain steel bars are only available in grade 230. Other grades are subject to buyer’s and manufacturer’s agreement.
This clearly has to be amended, because no less than the ACI Code & the NSCP call for a TS/YS ratio of 1.25 without any exclusion for rebars used in regions with high seismic risk.
This brings us to the significance of the TS/YS ratio.
ACI 318 explicitly calls for a TS/YS ratio of 1.25 without exception, for highly seismic Zone S (Zone 4). It also stipulates several important requirements as follows:
The specified yield strength YS should not be exceeded by more than 18,000 psi (124 MPa).
The TS/YS ratio shall not exceed 1.25
PNS 49 is also explicit in that it specifies a minimum and maximum permissible stress for yield stress. What the two foregoing requirements clearly state is that a limit has been set on the yield stress (YS).
Why is this so? This is clearly explained in ACI 318 Subsection 21.2.5 which we quote as follows:
21.2.5 – Reinforcement for Members resisting Earthquakes
“Reinforcement resisting earthquake induced Flexural Stresses and axial forces in frame members and in wall boundary elements shall comply with ASTM A-706, ASTM A-615, Grade 40 & Grade 60 reinforcement shall be permitted in these members if:
a) The actual yield strength based on mill tests does not exceed the specified yield strength by more than 18,000 psi (124.1 MPa).
b) The ratio of the actual ultimate tensile strength to the actual tensile yield strength is not less than 1.25.
Code Commentary R 21.2.5
“Use of longitudinal reinforcement with strength substantially higher than assumed will lead to higher shear and bond stresses at the time of development of yield moments. These conditions may lead to brittle failures in shear or bond and should be avoided even if such failures may occur at higher loads than those anticipated in design. Therefore, a ceiling is placed on the actual yield strength of Steel.
The requirement for an Ultimate Tensile Strength larger than the yield strength of the reinforcement is based on the assumption that the capability of a structural member to develop inelastic rotation capacity is a function of the length of the yield region along the axis of the member. In interpreting experimental results, length of yield region has been related to the relative magnitudes of ultimate and yield moments. According to that interpretation, the larger the ratio of ultimate to yield moment, the longer the yield region.”
Members with reinforcement not satisfying that condition can also develop inelastic rotation, but their behavior is sufficiently different to exclude them from direct consideration on the basis of rules derived from experience with members reinforced with strain hardening steel.”
3.0 CONCRETE
Oftentimes, the Structural Designer specifies the Design Strength (f’c) for his RC Design and leaves it at that. However, when reports of cylinder tests come in and there are reported failures, he responds immediately by ordering concrete cores to be extracted or worse, a load test. Both responses are costly and often not necessary!
All that is probably initially required is a complete understanding of the possible variabilities that can occur in concrete and also how as designer/specifier, he can control these variabilities to desirable limits and thus have a firm basis for acceptance/rejection.
What often happens is that the Designer treats concrete test specifications as fixed and any failure as absolute failures.
Concrete, as we have said, is a highly variable material and as such is subject to the laws of statistics. When the Designer specifies a Design Strength (f’c), he in effect should be requiring something higher than this value in order to ensure that failures are within acceptable limits. Implicit in this statement is the need to specify a Required Average Strength f’cr that is greater than f’c.
When the Engineer unrealistically refuses to accept the variability in concrete strengths and consistently demands that no tests fall below the Specified Design Strength (f’c), he unreasonably inreases the cost of the project, as the supplier has to increase his required strength design to ensure that his breaks do not fall below f’c. Thus, in effect, but perhaps without knowing it, the Designer imposes higher strength concrete which he does not need and forces the supplier to provide overly conservative Mix Designs.
Since stronger concrete is definitely more expensive than an Engineered concrete specification, the theme “Stronger is not necessarily Better again applies.
When the Designer/Specifier expects that concrete compression test results to be always equal to or greater than the Specified Concrete Strength (fc’) he unwittingly causes problems other than increasing the cost of concrete.
Higher strengths are obtained by limiting the Water Cement (WCR) Ratio (which causes a retrograde effect on the workability of the product) or by higher cement content.
However, the foregoing could cause some other problems:
Use of water reducing admixtures or plasticizers to increase workability means added cost per cubic meter.
Increases in cement content brings attendant problems of higher heat of hydration generated which could cause thermal cracking or high shrinkage cracking.
Thus, it would be necessary to gain a fundamental understanding of the variability of concrete and to accept the possibility that failures can and do occur even in a well supervised concrete batching, sampling and test operation or system. What is more important is to know how to control these variables, so that they can be placed within limits of acceptability in consideration of the criticality or demands of the structure. Evidently, not all structures require or should impose very strict demands on strength since in some structures, durability considerations are more important.
In a parallel vein, a nuclear containment structure would definitely have more critical demands on quality and strength as say an irrigation canal.
Thus, the use and application of statistical procedures as recommended by ACI 214 “Recommended Practice for Evaluation of Strength Test Results of Concrete” is critically important.
ACI 214.3R Approximately describes the need to apply Statistical Procedures in specifying strengths for concrete:
“Specifying the Strength of Concrete
When the Structural Engineer specified a “Design Strength” for his structure he in effect specifies a Specified Strength (f ’c).
Since the strength of concrete follows the Normal distribution curve, if the average strength of the concrete is approximately equal to the specified strength, one half of the concrete will have a strength less than the specified strength. Because it is usually not acceptable to have one half of the strength tests lower than specified stength, the average strength must be higher than the specified strength by some factor.
The specification writer, in consultation with the Engineer, writes a specified strength and the percentage of low tests that are considered acceptable for that class of concrete. ACI 318, “Building Code Requirements for Concrete” provides guidelines for selecting acceptable number of low tests.”
An example of a statement for strength in the specification might read:
“The average of all Strength Tests shall be such that not more than one (1) test in Ten (10) shall fall below the Specified Strength fc’ of 3,500 psi”
In turn, the concrete producer, in order to meet the above specifications would have to provide a strength that is
definitely higher than f ’c, called the required Average Strength (f ’cr). The Required Average Strength can be determined from the following formula:
Use of the Normal distribution curve to obtain the required average strength is illustrated in Fig. 3.1.
To calculate the required average strength, the Engineer must decide the specified strength and what percentage of tests falling below the specified strength will be allowed. When the decision has been made on an acceptable percentage of low tests, the probability factor can be determined using the properties of the Normal distribution curve. The probability factors for various percentages of low tests are given in Table 2 below:
The Standard Deviation S is obtained by analyzing the Concrete Producer’s data. Since the Standard Deviation for a project is not known at the beginning of a project, Chapter 4 of ACI 318 permits the substitution of a Standard Deviation calculated from at least 30 consecutive strengths on concrete produced at the proposed concrete plant using similar materials and conditions.
ACI 318 is more specific in the selection of the Required Average Strength f’cr to be used in the proportioning of concrete mixes.
ACI 5.3.2.1 States:
“Required Average Compressive Strength f’cr use as the basis for selection of concrete proportions shall be the larger of Eq (5-1) or (5-2) using a Standard Deviation S calculated in accordance with 5.3.1.1 or 5.3.1.2
ACI 5.3.2.2
When a concrete production facility does not have field strength test records for calculation of Standard Deviation meeting requirements of 5.3.1.1 or 5.3.1.2, Required Average Strength fc’r shall be determined from Tabl3 5.3.2.2 and documentation of average strength shall be in accordance with requirements of 5.3.3.”
TABLE 5.3.2.2 – Required Average Compressive Strength when data are not available to establish a Standard Deviation.
Thus, from the foregoing, it can be clearly seen that there is a rational way of specifying concrete strength which would relatively be more economical than an arbitrary and ambiguous requirement that absolutely No tests fall below the specified f ’c. This implicitly means that the Designer is in effect specifying “stronger” concrete. Implicit with our understanding is the acceptance of failures within the batch but which are within acceptable limits on the number of failures. The Design Engineer therefore needs to have a more thorough appreciation and knowledge of the variable nature of concrete as a Civil Engineering Material and how he can control it through proper application of statistical methods not just by specifying “stronger” concrete.
Evaluation and Acceptance of Concrete
Knowing what to specify and what to expect in terms of the variability of concrete test results is only half of the picture.
Having a clear basis for acceptance/rejection is the other half.
This brings us to just exactly what is meant by a “Test”.
A test is defined in 5.6.1.4 of ACI 318 as follows:
“A strength test shall be the average of the strengths of two cylinders made from the same sample of concrete and tested at 28 days or at the test age designated for determination of f’c.”
A lot of times, Design Engineers or even Project Engineers reject a concrete batch on the basis of a single cylinder break and without due consideration of the established criteria for Acceptance/Rejection which are stated below:
“5.6.2.3 Strength level of an individual class of concrete shall be considered satisfactory if both of the following requirements are met: a) Every arithmetic average of any three consecutive strength tests equals or exceeds f’c. b) No individual strength test (Average of Two Cylinders) falls below f’c by more than 500 psi.”
4.0 STRUCTURAL STEEL
Similar considerations govern the use of structural steel in highly seismic regions such as what we are in.
Particularly for built up sections which are commonly used in the Philippines, Substandard Plates from some Eastern European Mills are passed on as A-36 Steel.
When tested, the steels exhibit very high yield stresses (High Carbon Content) and Tensile strengths just slightly above the yield stress.
In effect, these steels would exhibit Brittle or non ductile behavior during an earthquake. Thus collapse would also probably be sudden.
Why do these proliferate in the Philippines?
It is because of several things:
Lack of knowledge of the Brittle Behavior of the steel.
Unscrupulous suppliers who try to pass this on as A-36 or other acceptable specified grade steel
Plain ignorance on the part of the Designer, Specifier or Project Manager
Tests have not been performed.
What is worse, if these are used with welded connections, serious incompatibility with the welding procedures specified for say A-36 steel and the high YS and TS steels could produce defective connections and embrittlement in the joints.
Again, sudden failure on the joints could result.
Often, the Design Engineer accepts these test results blindly since the steel strength test results are “Stronger” than was specified and therefore necessarily “Better”.
This is very much farther from the truth as the theme in this paper aptly applies:
“Stronger is not necessarily Better”
Although not within the scope of this paper, and since this has been extensively discussed in other fora, joints in structural steel complying with the current AISC and local codes have exhibited failures during the Loma Prieta Earthquake.
What does this tell us?
Making the joints compliant with what was then an existing code or even stronger does not guarantee proper structural performance.
5.0 SOILS
Soil is the ultimate structure on earth because all man made structures eventually rest on the soil. Extensive in occurrence, man has to contend with a highly variable material.
However, to some extentman can control the Quality of Soil through stabilization, amelioration or ground improvement and this is where the problem lies.
Always, the target is to produce a stronger material either by overcompaction or by stabilization.
Most of the time this is done in total ignorance of soil mechanics principles and soil behavior.
Compaction
The situation is best illustrated in the most extensively used procedure in Civil Works: – compaction
Compaction in granular soils is sometimes carried to extremes – Heavier compactors, – numerous passes more than what is required – just to make sure that what is attained is “stronger”.
Little do people know that overcompaction is not beneficial and in fact degrades the density initially obtained.
In clean granular soils subjected to overcompaction, the soils shears and density collapses beyond the optimal compactive energy (number of passes).
In cohesive soils, overcompaction results in remolding sensitive clays and causes strength loss.
In expansive or highly swelling soils, the compactive effort needs to be reduced and the Moisture Content kep wet of optimum to reduce swell potential and heaving.
In a former engagement, the author’s attention was called, as the results of Field Density Tests were being questioned vehemently by the contractor because the clean granular soils have consistently failed to meet specifications.
Upon investigation, the following observations were made:
The sub contractor was delivering from 9 to 14 passes on the soil with 15 MT vibratory compactors because:
Field Density Tests showed low densities consistently below the Target MDD after each day’s test.
Fuel is provided free by the Prime Contractor
Equipment is paid based on operating hours.
The soils are being compacted at “Optimum Moisture Content” (OMC)
Parallel Cracks transverse to the direction of compactor travel have formed in the overcompacted soils.
Trial compaction works were ordered and it was found out that only 3 to 4 passes were needed to reach specified densities.
In addition, it was finally made clear, but with much difficulty, that there is no “Optimum Moisture Content” when applied to clean granular soils. The Contractor all the while was taking pains in controlling moisture to OMC due to a lack of understanding of the behavior of clean granular soils subjected to compaction. The soil either has to be very very dry or very very wet before compaction to attain maximum density.
As a result, the subcontractor suffered a severe reduction in rental revenues as the compactor fleet was reduced by more than 50% although additional water tankers were needed.
The Prime Contractor in turn made substantial savings and the construction schedule was substantially speeded up.
Again this is another case where
“Stronger is not necessarily Better”
Why is OMC not relevant in Clean Granular Soils?
Let us look at the characteristic compaction curves for Granular Soils.
Looking at the compaction curve above for clean granular soils, immediately tells us that this is very much different from the normal parabolic shape of fine grained and cohesive soils. The twin peaks P1 & P2 indicate that the soil can either be compacted very verydry or very verywet and that OMC is not relevant
Instead of a Parabolic Shape, the “S” Curve can be clearly seen. The “Trough” between 0 to 12% MC (varies with soil type) is the bulking moisture content where surface tension of the moisture holds the grains apart. Thus density is low.
Without understanding the characteristic behavior of the soil in the Moisture Density Curve, very costly and highly erroneous compaction procedures would result.
Case where Building “Strengthening” caused more Distress
Another extreme reaction due to a wrong perception of Soil Behavior and its telltale effects happened in one project where we were involved to evaluate a Building that was “Sinking”.
Earlier remedial measures directed towards the mistaken assumption that settlement was occuring resulted in a costly but unneeded measure, but worse, it even aggravated the Structural Damage to the Building.
What was then wrongly perceived as “settlement” was in fact heaving. Since the perception of the direction of movement was based on guesswork, and because no tests were performed, incorrect or inappropriate remedial measures were implemented as follows:
Phase 1 – Extensive Structural Repairs and Strengthening were made on the Waffle Slab RC Deck.
Result : Distress continued despite the repairs.
Phase 2 – Because Phase 1 continued to “settle”, Piled Foundations were specified on the next Phase. In effect making the foundation stronger by using Piles to bypass “weak” soils. Result : The Piled foundations, rather than reducing the damage, caused more severe damage in a shorter period of time than the level of damage sustained by Phase 1 !
The two Buildings were badly cracked but as stated, the Pile Supported Buildings cracked more extensively and more severely than the unpiled structure !
Subsequently, during our investigation, we found out that heaving and not settlement was occurring. The only solution to arrest the cracking was to remove a layer of Base Course Material composed of slag from a Steel Mill.3]
The Contractor and Owner’s Project Engineer thought that slag being heavier and stronger would be better and cheaper than normal granular Base Course since it was available for the asking and compacts well. Unfortunately, the slab corroded under the very acidic ground water resulting in expansion and heaving.
“The “Stronger” Slag Base Course proved to be not only inferior but also caused heavy damage than a weaker material – in this case granular Base Course
Going back to the Piles, which were perceived to offer a “Stronger” Foundation, severe cracking and more extensive damage resulted from the restraint offered by the Piles which served as Anchor Piles preventing the Phase 2 Structure from rising.
The restraint on the Walls and Columns caused more severe cracking than the Phase 1 Building since the earlier building was founded on spread footings and was relatively more free to ride the heaving than a “Stronger” Pile “Supported” (Restrained) Structure.
In these two instances involving the R&D facility, wrong understanding of the soil behavior and lack of any tests done on the soils resulted in a very expensive but ineffective and far more damaging response to the problem.
Critical Engineering Judgment was definitely needed in this case.
6.0 CONCLUSION
The foregoing discussions and examples based on real world experiences show that sometimes wrong reactions or responses to the problem bring about unwanted consequences.
Particularly in the practice of our profession, the normal tendency when a problem occurs is to strengthen or use stronger materials to ensure an “imagined” factor of safety which in reality is a double bladed factor of ignorance !
We can not allow this to happen as this can cause unwanted and oftentimes dangerous outcomes.
We should strive to understand material behavior and the Environmental Influences which can alter or totally change the performance that we expect from our structures.
It is necessary for all of us gathered here to spread this message to our subordinates and apprentices so that the lessons of the past will not be repeated.
Emilio M. Morales CE, MSCE, F.ASCE, F. ASEP, F. PICE1 Mark K. Morales CE, MSc2
ABSTRACT: Civil Engineers are always confronted by the uncertainties in the subsurface that lie beneath their proposed or existing structures. While most often, soil borings would be adequate, in some applications this is not necessarily so as borings give detailed information but only at discrete locations and anything in between is “interpolated”.
GPR on the other hand, gives a continuous information stream of the subsurface along its scan lines. 3D visualization is also possible by using orthogonal mesh of scan lines and the mesh sizes can be varied to suit the requirements.
While it is not a replacement for the use of borings to determine soil design parameters at discrete locations, GPR is a very useful adjunct to the borings in gathering reliable information particularly in-between borehole positions.
In problematic areas such as in Karst terrains or in areas with suspected Geotechnical or Geologic anomalies or even man made buried objects such as Ordinance or buried pipes, a continuous visualization of the subsurface is necessary in order to identify problem areas and thus enable an adequate plan of action when designing the substructure or determining what lies underneath.
Particularly in large projects, surprises in the subsurface have cost significant increases in the construction budget and/or resulted in large time delays.
Ground Penetrating Radar (GPR) has been used successfully worldwide for the location of buried objects and mapping the subsurface stratification more clearly.
In this paper, we wish to share the underlying principles on the use of GPR and also highlight various successful applications of the technology in solving day to day Civil Engineering problems.
1. INTRODUCTION
Often we are confronted with the need to determine that what lies underneath a project. Sometimes, borings may not be adequate to give a detailed picture of the subsurface. This is critically important in the case of suspected presence of Geologic or Geotechnical anomalies such as faulting, cavities or manmade objects and even explosives.
Particularly where the exact location of the anomaly is unknown, the use of non invasive methods would avoid the large disturbances and disruption that excavation or borings would bring.
Thus, Geophysical Methods such as Seismic Refraction SR and Ground Penetrating Radar GPR come into the fore in providing a clear visualization of the subsurface. Of these, GPR comes as a good candidate for this purpose.
2. BACKGROUND
This Paper presents our local practical experience in the deployment of Geophysical methods, most specifically GPR to address and provide solutions to various practical problems where conventional approaches may not give adequate information or may not provide it in a faster or more accurate way.
Although Geophysical methods address the need for more information compared to conventional borings, these are not substitute to actual soil borings when soil design parameters (strength and compressibility) are needed.
However, borings may provide only limited discrete information points or are limited because of budgetary restrictions while Geophysical methods may provide a continuous data stream or even three dimensional images of the desired target of interest. Thus these two methods are complementary and would provide a more meaningful information record when done together or when augmented by each other.
One of these valuable geophysical methods is Ground Penetrating Radar or GPR.
3. ORIGIN
Ground Penetrating Radar Technology was an offshoot of the military use of radar and was spurred by the need to do research in the thick ice of the Polar Ice Cap. The developed technology has now also reverted to military use again in the detection of buried mines (IED’s) and arms caches.
3.1 USES
Used for detection of Cavities, caves and other Geologic Anomalies such as buried faults.
Used for detection of Buried objects such as pipes, IED’s and Archeological artifacts
Used for environmental scanning to determine waste landfills and pipeline leaks.
Used For determination of structural thickness of Roadways and pavements
Used for detection of Rebars and other embedded Objects in Concrete.
4. BASIC EQUIPMENT DESCRIPTION AND OPERATION
4.1 Equipment
The basic field equipment consist of the Control Computer, the Electro Magnetic Pulse(EMP) Antenna and the Cart with the associated power supply and distance measuring device which is synchronized with the computer to give accurate distance readings with the scanned images. There is also an option to connect this with a Global positioning system or GPS.
MALA PROEx Control Unit with power supply with internal calibration routines built in.
MALA Optical Module – connects to all antennas through high speed fiber optic cables.
MALA measuring wheel used for automatic distance measurement and control of the survey line.
MALA XV Monitor – the dedicated monitor includes all bult in software (Groundvision Software) to view the survey and process the profiles without the need for a laptop.
MALA Rough Terrain Cart – contains all the GPR equipment and accessories including the distance measuring pulse encoder.
4.2 Operation
More simplistically, radar impulses are transmitted at a frequency of 100 to 500 kHz from the equipment and are bounced back or absorbed by objects depending A receiving antenna receives the bounced signals or pulses and are processed by computer in Real Time to provide a computer image of the subsurface. on the material stiffness and saturation and other interferences. See Figure Below: 3]
The choice of Ultra magnetic Impulse Frequency to use determines the effective depth for exploration. The Frequency is inversely proportional to the effective depth of exploration. Very high Frequencies are used for shallow depths such as for roadway pavement structure investigation where a continuous record of the pavement structural thickness to the nearest millimeter is desired for dispute resolution or for QA and audit purposes.
5. IMAGE POST PROCESSING AND INTERPRETATION
After the initial field scanning and data gathering, the image is post processed in the office using proprietary data interpretation software such as OBJECT Mapper, EASY 3D and GROUND Vision.4
Figure 2. The figure above shows the GPR SCAN IMAGE showing the locations of detected cavities
The image is post processed in a high Resolution large screen TV Monitor and desktop computer using the applicable software.
Figure 3. Image Processing using High Resolution TV Monitor
Cavities or anomalies show as distinct features in the post processed scan with characteristic signatures or shapes.
Cavities are displayed as hyperbolic shapes and solid obstructions such as buried concrete as very dark parallel lines.
Soil stratification or layering are also discernible due to the different contrasting layers with various shading and strengths. The darker the shade the stiffer or harder the layer encountered.
In some cases, pipe leaks can also be discerned due to the disaggregated stratification and large disturbed lines in the vicinity of the pipe leak breaking the layering or stratification.
With the additional software tools, visualization in 2D & 3D are easily made because of the large contrasts in the image as well as the characteristic signatures of anomalies and obstructions in the subsurface.
Thus, as an example, the location of abandoned piles or the presence of buried structures and even unexploded ordnance such as bombs or shells can be detected provided these are within the scanning path of the equipment.
6. LIMITATIONS OF TECHNOLOGY
The presence of highly saturated plastic clays would tend to mask the radar signals and may produce no radar image at all or very hazy ones leading to some inaccuracies in the procedure. In addition, the presence of surface obstructions such as concrete pavements, the presence of subsurface boulders and other objects would tend to affect the accuracy of the signals and the images generated.
In highly conductive zones, such as saturated montmorillonite clays or saline marshes, it is almost impossible to obtain useful results below 1-2 wave lengths of the antenna. 5
7. PRACTICAL APPLICATIONS
7.1 General
The following applications are discussed to illustrate the versatility of the GPR equipment in seeing the unknown.
Most of these applications were done with basic scanning procedures using a 250 MHz antenna.
7.2 Detection of Fortune Hunting Tunnel
We conducted the soils exploration program for this facility consisting of several buildings in Lahug, Cebu. Several borings indicated cavities at approximately 20.0 meters depth. Originally these were suspected as cavities in the Karstic limestone environment of the area. However, because of the consistent depth of occurrence and the size of the cavity as detected in the borings, we tried to trace the occurrences. Through enough, the trace started from outside and continued towards the main building. We recommended the conduct of additional borings and GPR scanning of the area. The owner did not approve this as the depth and size of cavities were very small.
However, towards the completion of the main building and during the excavation of storm drainage, the tunnel entrance, daylighted near the edge. Further probing indicated that it was indeed a manmade tunnel. The pictures and the illustration 6clearly show what has been initially suspected as solution channels was in fact a fortune hunting tunnel.
The results of the GPR scanning revealed and confirmed the general Tunnel alignments earlier revealed by the Subsurface Soil Exploration Program conducted for the Temple facility.
In addition, a separate Tunnel alignment was indicated along the Housing area and possibly continuing towards the parking area at the NW corner of the Main Parking. Generally, the GPR scans as stated agreed with the general Tunnel alignment for the main tunnel detected during the site soil exploration.
The main tunneling effort was directed towards the Main Hill as the old villa in the hilltop was used by the Senior Japanese staff for Lahug Airfield. It has always been common knowledge that where the Japanese Generals are billeted, buried treasure can be found.
Figure 4. A 3D sketch of the Tunnel System as discovered by GPR and verified by subsequent investigation at the portals
Thus, it is possible that the tunnel would have continued towards the old house footprint where the Tunnel is approximately situated although this cannot be ascertained as the building mat foundation has already been constructed.
As a result, the main tunnel and the branch tunnels were ordered sealed with concrete grout with the former taking in 7 Transit mixer Loads of concrete and the latter another 5 Transit mixer loads.
Figure 5. The Hyperbolic Symbols indicate the presence of small shallow cavities exposed during excavation
7.3 Detection of Cavities under Buildings
7.3.1. Basement Excavation
An excavation for multi-level basement uncovered initially large cavities that were daylighted by the excavation. We were requested to undertake GPR scanning to verify if there are any more hidden cavities underneath the level of the mat foundation.
However, suspected voids filled cavities, which are not of significant size have been inferred from our scanning profiles as well as several manmade structures such as footing tie beams.
Visual manifestations of some exposed tunnels were evident at the footprint of the building within the basement excavation. These were photographed and also marked in our plans. These discovered large sized tunnels prompted the conduct of GPR scanning in order to locate any further occurrences.
Some of these tunnels that have daylighted are relatively large and are either hollow or filled partially with soil or decayed organic materials.
The GPR survey at the basement has not detected any hollow tunnels or cavities comparable in size to the cavities earlier excavated and daylighted by the contractor for the basement excavation.
Figure 6. The picture shows the occurrence of cavities (arrows) which are filled with Organic Materials
The cavities as detected were relatively very small and possibly the locations for fossilized tree roots or vegetation.
Thus construction proceeded for the mat foundation without any concern on the presence of cavities.
7.3.2. Cavities and Solution Channels in karstic Limestone
The site of a proposed airport is underlain by Karstic limestone which is known to have major cavities and solution channels in a Southern Visayas Island.
We were asked to undertake borings and GPR scanning in order to map or delineate the extent of the cavities.
Figure 7. Partial view of Apron area with identified cavities
7.4 Detection of Buried Waste Dumpsite
We were asked by a client to survey and delineate suspected waste dumpsites within their factory which was buried a long time ago.
We conducted a grid survey with orthogonal scan lines spaced 10.0 meters apart in both directions.
The GPR scanning identified the location and extent of the dumpsites which we then mapped and referenced against the plant grid coordinate system. The detected landfill were earmarked for disposal outside the plant battery limit to an approved Sanitary Landfill.
Figure 8. The Differences and Contrast of the layers are evident. The waste is identified by dark and light layers. The Light blue color in the map indicates the horizontal extent of the waste Landfill.
7.5 Detection of Buried Creeks and Depressions
Sometimes, in the haste to make land saleable, land development was done haphazardly, and creeks and depressions were hurriedly filled with pushed over materials that are uncompacted. These have often caused problems when structures are built over these areas, as settlements and deformations may result when the pushed over material is loaded.
The figure below shows a creek which was filled with loose fill and covered by compacted material above the creek.
The creek shown by the depression is shown as well as the NGL portrayed by the bold line. The two images were taken at 20 meter offsets and when represented in plan , show an inclined creek crossed by the perpendicular scan lines.
7.6 Detection of Leaks Under Tanks and Pipelines
In one occasion, we were engaged to undertake detailed scanning inside a food factory where old sewer lines and storm drains were buried under the factory floor. The objective was to locate the decommissioned utilities, but more importantly, to locate the source of the leak in a sewer line that is mixing with the storm drain and thus causing a concern due to cross contamination.
Numerous unsuccessful attempts were tried before in locating the suspected leaking pipes causing disruptions in the operations as these have to be excavated at the suspect locations.
Figure 9. Shows the image of two pipes in parallel both causing upheavals in the subsurface immediately below indicative of a leak
In another engagement to detect cavities and solution channels, we were able to detect a leak point underneath a water tank as shown by disruptions in the soil layers underlain by cavities in karstic limestone. Dissolution of the limestone can create a sinkhole which can collapse the tank.
Figure 10. The figure above shows a buried pipe with tell tale signs of upheaval in the layering possibly caused by leaks.
7.7 Detection of Buried Utilities
Buried utilities are a concern particularly during excavations or even during borings at a site. For utilities, where as-built plans have not been prepared accurately, it would be difficult and sometimes even dangerous to undertake invasive methods or excavations without scanning the subsurface. This is particularly true in the case of pipelines for Petroleum or LNG or other lines such as water mains. Provided that the scan lines are Orthogonal to the pipe alignment and the scans are done at regular intervals, a 3D visual image can be generated using software post processing.
Figure 11. 2D and 3D Visualization of a Pipeline using Software Postprocessing
7.8 Very Shallow Non-Invasive Scans
Where shallow non-invasive scans are needed particularly in large area scans or relatively very long alignment investigations, there is no substitute to the use of GPR for mapping the subsurface. However, a higher frequency antenna is required as the depth of penetration varies in an Inverse proportion to the Antenna frequency. The Lower the frequency, the deeper the depth scanned.
Figure 12. The figure above shows the presence of pipes as well as buried concrete with the rebars showing as closely spaced block dots
7.8.1. Roadway Pavement Structural Investigation and Audit
The pavement structural thicknesses of roadways can be determined either at discrete locations or as a continuous stream when connected to a GPR and a vehicle pushed or drawn GPR system. The alignment locations are automatically linked by GPS to the GPR records and even to a real time video.
This is particularly useful when making pavement condition surveys or when doing QA verification of the as constructed pavement structural thicknesses.
Figure 13. A vehicle system with the GPR and GPS is used for continuous Roadway surveys 7]Figure 14. A section of an AC pavement along the alignment showing the layer thicknesses to within a millimeter accuracy (by scaling the depth)7]
7.8.2. Detection of Embedded Rebars and Conduits in Concrete
Another practical use for a GPR system is the determination of Rebar layouts or embedded conduits in concrete structures.
Figure 15. The scanning and actual layout vs the scanned layout is shown in the above pictures from Mala Geosciences
8. SUMMARY AND CONCLUSIONS
GPR as shown in the examples can be truly versatile equipment in helping the engineer see the unknown and in the process make more informed decisions about his project or solutions to problems confronting him.
GPR allows a clear visualization of the subsurface in 2D or 3D. Intelligent deployment of the technology requires a keen eye to detect the anomalies and their differing signatures. However, with more advance software for post processing, the GPR becomes a very powerful tool indeed in the hands of the Engineer.
1] Emilio M. Morales CE, MSCE , Carnegie Mellon University, Principal EM2A Partners and Co., former Senior Lecturer, UP School of Engineering, Graduate Division, Chairman, ASEP NSCP Code Update Committee, Chairman, ASEP and PICE Geotechnical Committees.
2] Mark K. Morales CE, MSc University of California, Berkeley, President PGA Earth Structure Solutions, Instructor, UP School of Engineering, Graduate Division.
3] REF 1.0 From Internet Download TEXAS DOT Presentation of GPR in Civil Engineering 4] Mala Geosciences SOFTWARES
5] SEGJ. “Application of Geophysical Methods to Engineering and Environmental Problems”. Advisory Committee on Standardization, The Society for Exploration Geophysicists of Japan, 2004.
6] Illustration and photo courtesy of Engr. Rommel Fajardo.
The tragic loss of 58 lives in the Cherry Hills landslide attracted a lot of Philippine & International media attention and with it a lot of speculations and rumors as to what caused the slide. Several professional organizations and government agencies were also involved in the various studies and investigations to understand what really happened. This report summarizes and documents the work of the committee, including the methodologies and tools employed in reconstructing the conditions before and after the landslide, its findings and conclusions. This paper summarizes the collective independent findings and conclusions of the authors.
I. INTRODUCTION
Right after the Cherry Hills Landslide, which occurred on the night of 3 August 1999, the Philippine Institute of Civil Engineers (PICE) and Association of Structural Engineer of the Philippines (ASEP) mobilized members of its Geotechnical Committees in order to volunteer its services in the documentation of the Cherry Hills Landslide. The intention was to focus its attention on the Engineering aspects of the overall investigation. It was necessary to understand what caused the landslide, how the landslides occurred and how such mechanism/s can be prevented or avoided in the future. It is the intention to disseminate this report to all interested parties and to the Engineering Profession in particular so that lessons learned can be applied to prevent future similar accidents.
2. BACKGROUND OF CHERRY HILLS LANDSLIDE
(1) Location of Cherry Hills Subdivision
The subdivision is located in Antipolo City, Province of Rizal, Luzon Island, the Philippines. It is situated in saddle like fashion in an elevated terrain cut from a mountain leaving the East and West Flanks.
It is flanked by two subdivisions, Park Village Subdivision to the North and Peace Village to the South. The East and West flanks are bounded by the mountain sides left after the cut. The Eastern Summit is at elevation 255m Map and the Western side is at elevation 233m. The subdivision cut from the mountain side is approximately 26m at its deepest.
(2) Extent of Development of Cherry Hills
The subdivision encompasses an area of approximately 5 Hectares. All the roads have been paved with plain Portland cement concrete. The subdivision residential units consist of two and single storey houses that are either single detached or row housing. These are light roofed houses with hollow block wall construction and reinforced concrete columns on isolated footings.
(3) The Landslide
The landslide occurred at approximately 7:00 PM of August 3, 1999. Several hours before the event a lot of residents have evacuated their homes because of telltale signs of the impending slide. Cracks were being observed in some houses which continued progressively, thus, providing ominous signs that were heeded by some.
When the landslide occurred, it was very sudden and according to some eyewitnesses, occurred within five seconds. Two loud noises were heard during the landslide. Fifty Eight (58) lives were lost and one unaccounted for in this slide event.
Interviews with some homeowners indicated that there have been manifestations of movements in the Subdivision platform (creep) as manifested by crackings on the walls and difficulties encountered in the closing and opening of doors and windows. this happened several months before the landslide.
3.0 DATA GATHERING FOR THE ENGINEERING STUDIES
With the data already collected on the Geology of the area and specifically the orientations of bedding planes and joints in the rock mass, the Geotechnical Investigation Team concentrated on the following objectives:
(1) Data Gathering
a) Reconstruction of the Digital Terrain Model (DTM) of the area from the National Mapping and Resource Information Agency (NAMRIA). Maps were done as the reference point for the subsequent subdivision development, to establish platform elevations.
b) Mapping of the slide zone and Cherry Hills Subdivision in relation to the existing Digital Terrain Model by Global Positioning System (GPS) Surveys.
c) Gathering of subsurface data by conducting soil exploration in the slide zone and the undisturbed areas.
d) Gathering of intact block samples for strength testing of cores obtained and classification of soil samples using the Unified Soil Classification System (USCS).
e) Extraction of rock cores from intact blocks and simulation of the effects of groundwater conditions on intact cores through saturation (obtained from within the same sample block).
(2) Analysis of Strength Data
Numerous Unconfined Compression Tests (UCT) were conducted on intact cores obtained from borings and from corings done on block samples gathered from the slide areas. The cores consisted of the various layers of sandstone and the thin siltstone seams interbedded with the sandstones. The results of the Unconfined Compression Strength Test show the range of values of Uniaxial Compressive Strength (qu) of the rock layers in the area.
The Scatter Chart in Figure 1.0 below shows the values for both rock types obtained from the borings.
Although these represent the material strengths of the intact rocks from a generic sense, it does not give an idea as to the actual Characteristic Rock Mass Strength (CRMS) during the slide. The Characteristic Rock Mass Strength is the “average” strength of the rocks along the failure plane at failure.
For determining the latter, it would be necessary to consider the degree of jointing, weathering and the other environmental factors that could affect the characteristic strength.
The Uniaxial Compressive Strengths from intact cores served only as the reference base or starting point from which approximations of the CRMS at impending slide could be obtained. This will be discussed subsequently.
(3) Effect of Water Saturation on Strength of Cores
The cores from within the same block samples were grouped and subjected to immersion for 24 hours, 48 hours and 72 hours.
The plot of the Unconfined Compressive Strength qu (kg/cm2) vs. Moisture Content (%) is presented in Figure 2.0 for Sandstone and Siltstone Cores.
The trendline indicate the decrease in qu with increasing moisture content clearly establishing that water saturation could have an effect on the strengths.
(4) Climatic Effects
The unusually wet weather and abnormally high rainfall occurred in the months before the landslide. This was preceded by the El Niño which in contrast is characterized by extended droughts and unusually very dry and hot climate. This phenomenon was followed by abnormally high rainfalls in the months and days immediately preceding the slide. (Fig. 3.0)
Fig.3 Rainfall Chart Preceding the Landslide Event
(5) Test for Expansion Potential
The siltstone materials were pulverized and tested based on the Unified Soil Classification System (USCS).
All the siltstone materials classified as “MH” (Highly Plastic Silt). The very high Atterberg Limits. Liquid Limit (LL) values (>75%) and the relatively high Plasticity Indices (PI) (PI=LL– PL>20) indicated that the siltstone is moderate to highly expansive and therefore subject to shrink and swell cycles.
A further test was undertaken by subjecting sample to swell pressure test. The test confirmed that the siltstone material MH (Highly Plastic Silt) was really moderately expansive as it generated a confined swell pressure of 42.6 Kpa (890 psf).
This could have contributed to the disturbance and movements in the upper layer joints from shrinkage and expansion prior to the slide after saturation.
(6) Results of Field Borings
The Field Borings aided in characterizing the subsurface materials both within and outside the slide zone. It also indicated the depth and extent of disturbed materials of the slide zone and the groundwater conditions at the site after the slide.
In addition, it gave an indication of the Rock Quality through the percentage core recoveries and also through its Rock Quality Designation (RQD) values. The plot of the RQD values taken from the immediate area from 4 Boreholes and numerous core samples are shown in a Scatter Chart, Figure 4.0.
The RQD values as can be seen are relatively very low and indicate the highly fractured condition of the rock materials even in the undisturbed areas.
4. ENGINEERING STUDIES AND ANALYSES
(1) Determination of the Characteristic Rock Mass Strength (CRMS)
The shear strength of an intensely fractured rock is difficult to obtain as it would be difficult, if not impossible, to recreate or model the jointing and orientations of the rock under a full scale load test of the slope.
Wyllie1) stated that structures founded on Fractured Rock containing no distinct fracture surface on which sliding can take place, may still fail in shear if the shear strength of the rock mass is exceeded.
Because of the inherent difficulty of sampling and testing large samples of Fractured Rock, Wyllie proposed two empirical methods for determining the shear strength of the rock masses. These two procedures are:
a) Back analyses of the failed slope setting the Factor of Safety equal to 1.0 and obtaining paired values of cm and Phi by varying the value of “cm“ and getting the corresponding Phi value. These paired values are then compared to historical records of slides that have been analyzed in the past using this same procedure.
b) Substitution into a formula using the Hoek Brown criterion in order to obtain values of cm and Phi by drawing a Mohr’s Circle diagram of the failure condition.
The engineering analyses procedures adopted in this report followed these two empirical procedures as recommended by Wyllie to obtain values that could be used for the ensuing stability analyses.
The engineering studies and analyses took into account the following information in order to reconstruct the slide mechanism:
a) Geometry of the slopes prior to the development of Cherry Hills as a Subdivision.
b) Post Development Slope Geometries and existing platform elevations prior to the slide.
c) Analyses of the slide geometry and locations of various landmark features.
d) Review of the air photos and their interpretation.
e) Recorded observations from various photographs of the site during the various field trips including location of displaced vegetation, houses, streets, etc.
f) Results of the Subsurface Soil Exploration, Test Pits and Laboratory Tests conducted.
From the foregoing, a composite picture could be formed and a fairly reliable model of slope geometry before the slide could be obtained.
(2) Slope Geometry Determination
Slope Geometry was obtained and verified from the results of the DTM and the GPS Surveys.
(3) Approximation of Rock Mass Strength
Closely or intensely jointed rocks behave more like particulate materials (soil like behavior) when disturbed and exhibit spoon shaped or stepped path slides at failure. Thus, it would not be correct to rely on the intact core strengths for a back analysis of the slide as it would invariably yield very high factors of safety.
In a similar vein, it would not be correct to expect that the intensely fractured Rock Masses would behave and move as huge intact blocks (Topples) as would normally be expected for less closely spaced jointed rocks.
Bieniawski2) developed an empirical approach to classifying highly jointed Rock Masses by the Rock Mass Rating (RMR). The RMR is a qualitative procedure to characterize fractured rocks. Based on this, the approximate RMR value for the Cherry Hill Rocks is as follows: RMR Sandstone = 30.
The RMR is in turn used by Hoek to quantify the shear strength of Fractured Rocks by yielding“m” and “S” values which could be applied to formulas to yield the characteristic shear strength of the Rock Mass based on a curvilinear failure envelope. The “m” and “s” values as quantified by this procedure and used in this study are as follows:
Sandstone: m = 0.275 s = 0.00009 Siltstone: m = 0.183 s = 0.00009
(4) Back Analysis Procedure
To complement the empirical procedure of determining the characteristic strength of the Intensely Fractured Rock. Wyllie also proposed the use of Back Analysis of the Failure.
This procedure required carrying out a slope stability analysis with the factor of safety set at 1.0 (F.S. = 1.0) and using available information on the position of the failure surface, the ground water conditions at the time of failure, etc. This procedure however involves two unknowns, the Friction Angle “ϕ ” and the cohesion “c”. A number of stability analyses needed to be carried out with a range of cohesion values used to yield corresponding Friction Angle Values (ϕ ) by always setting F.S.=1.0.
The paired values (c, ϕ) obtained were then plotted in a chart of Cohesion vs. Friction Angle as shown in Fig. 5.0.
From this chart can be selected the most likely (c, ϕ ) value to be used. While the “exact” (c, ϕ ) value at failure may not be known as there probably are other localized factors involved, the values obtained could give a fair approximation of the characteristic strength along the failure plane at impending slide.
5. SLOPE STABILITY ANALYSES
Slope stability analyses were performed using Slope/W, a proprietary Slope Stability Analysis Program. SLOPE/W is a stability analysis program that uses the limit equilibrium theory to solve for the factor of safety of earth and rock slopes using various methods (Bishop, Janbu, Corps of Engineers, Morgenstern and Price, etc.) The analyses consisted of runs at various stages in the predevelopment and development stages culminating in the final condition leading to the landslide.
The initial stability analyses performed generally used an assumed homogeneous soil mass and arbitrary strength parameters for the various layers, in order to initially identify possible failure modes and their locations. Subsequent analyses used the geologic model and layering sequences based on the Geologic Profiles.
(2) First Pass “Slope Stability Analyses”
A conventional “First Pass” slope stability analysis was conducted using the Characteristic Fractured Rock Mass Strength in order to define potential failure planes. This would aid in identifying where the critical conditions are, based on the slope geometries and characteristic Rock Mass Strength. Cohesion and Friction Angle (cm and ϕ m). The computer program was allowed to automatically search for these critical slip circles from which candidate locations as defined by low factors of safety were recorded. In addition, the search area was also concentrated on suspect critical areas in order to fully understand how the slide occurred and whether there was a single massive slide or a sequence of slides occurring one after the other within a few seconds.
(3) Back Analyses Result
The procedure was conducted for both dry and saturated slope. (Figures 5 and 6)
It is significant to emphasize what the above plot is telling us, which are:
a) For the same failure situation (FS=1.0) higher strength parameters (c & ϕ ) would need to be mobilized at saturated conditions to prevent failure. (Failure occurs at higher strengths)
b) Conversely, for dry conditions, lower strength parameters (c & ϕ ) would suffice to prevent a failure condition from occurring.
Thus, we can say that failure during high saturation and consequent pore pressure buildup was the most likely mode of failure.
The family of points show the possible combinations (paired values) of (c & f ) likely to cause failure. From within these paired values probably lie the characteristic Rock Mass Strength at time of failure.
(4) Final Slope Stability Analyses Results
The back analyses generally confirmed and agree with the actual slide geometry. The rotational component of the actual slide is clearly explained by the results of the slope stability analyses.
The results clearly indicate that the main failure mode is rotational and that the block sliding mode is less critical.
It also clearly shows that without saturation, failure would be remote.
6. VARIOUS INFLUENCES IMPACTING ON THE SLIDE INITIATION
(1) Climatic Effects
The Philippines encountered extremely severe prolonged draughts brought about by the El Niño Phenomenon. This extended period of extremely dry weather could have induced dessication and shrinkage cracking of the siltstone layers thus causing it to weaken.
Clay infillings on major joint systems could also have been induced to crack due to shrinkage from extremely dry weather.
Unfortunately, El Niño was immediately replaced by the unusually heavy rains which was totally the opposite of the El Niño. Periods of heavy constant rainfall were encountered in the month before the landslide event.
The two weeks preceding the landslide have seen the heaviest rainfall in the area in many years with the last 3 days immediately before the major landslide event the heaviest ever encountered.
The shrinkage caused by extremely dry weather induced cracking on the clay infilling of the joints, thus, further weakening the strength of the intensely jointed rock and causing some movements to occur.
The extremely heavy rainfall in turn induced the injection of water into these cracks and joints causing the following effects:
Increased seepage and infiltration into the joints causing widespread lubrication of the Highly Fractured Rock Mass.
Increased buoyancy or uplift effects, thus reducing effective stresses significantly.
Increased water pressure induced swelling and expansion of the highly expansive siltstone layers causing heaving and disturbance of the intensely fractured rocks at some locations.
Increased saturation induced weakening of the siltstone by as much as 35% based on simulated saturation conditions performed in the laboratory.
The very heavy rainfall in the weeks and days immediately preceding the Cherry Hills landslide event had contributed a critical part in the initiation of the slide. In fact, several other minor landslides in the areas surounding Cherry Hills were triggered days before the Cherry Hills landslide because of the heavy rainfall. Thus, clearly indicating the critical role of water saturation and buildup of pore pressure on the slide.
In this investigation, the only means to quantify or recognize the impact of water saturation in the analyses procedures were as folows:
Strength degradation of the siltstone and sandstone layers by taking the mean strength at 72 hours saturation of the sandstone and siltstone layers as the intact Unconfined Compressive Strength qu (r) for use in the Hoek Brown formula and the back analyses of the slope stability.
Taking into account the elevated phreatic line in the slope stability runs and thus also implicitly admitting the reduction in the effective stresses due to the elevated water table.
However, these effects in themselves were very significant as indicated by increased Factor of Safety at unsaturated (Dry) conditions and the very low Factors of Safety (Failure) resulting from the analyses simulating the above saturation conditions.
(2) Strength Degradation of Rocks
The results of the laboratory tests on the Siltstone layers obtained from intact block samples in the slide areas clearly established the Potentially Expansive nature of the siltstone layers as evidenced by:
Very high Liquid Limit (LL) and Plasticity Indices (PI) averaging 80% and 22% respectively classifying therefore as MH.
Generated Swell Pressure of approximately 802 psf in the siltstone sample subjected to confined swell pressure tests.
Disintegration of cores when subjected to immersion after cooling from oven drying, crudely indicating or simulating the susceptibility to degradation due to drying and saturation effects.
Significant strength degradation due to swelling and volume changes of siltstone core samples subjected to varying periods of water immersion (24, 48 & 72 hours).
Strength degradation of the siltstone layers was significant and movements in this layer due to shrinkage cracking and expansion due to prolonged water saturation could have affected or disrupted the insitu characteristic strength of the intensely fractured rock masses as to also have a contribution to the initiation of the landslide.
(3) Sandstone Layers
Strength degradation from saturation of the sandstones were not as pronounced as in the case of the siltstone cores. However, the presence of water at saturation levels clearly caused lubrication and reduction in effective stresses at the joints and weakening of the clay infillings as to have a contribution to the overall weakening of the intensely fractured rock masses.
(4) Intense Fracturing of the Rock Masses
The intense fracturing of the rock masses is visibly evident in the outcrops and the highly reduced sizes of the detrital materials in the slide. The use of Triple Tube Core Barrels (Mazier Sampler) was resorted to in order to reduce the disturbance effects of the sampling procedure.
The intense fracturing of the rocks in Cherry Hills and surrounding areas is probably due to its proximity to the Binangonan Fault identified in the MGB Report. Faulting and associated movements near this fault could have caused this intense fracturing, reducing effective sizes to within a range of 150mm to 300mm. In the borings conducted at site, Rock Quality Designation (RQD) values were seldom above 25% indicative of Highly Fractured Rock condition even in the areas not involved in the slide.
As a result of this intense fracturing, the rock masses would tend to behave more as soil like materials rather than as intact coherent masses.
This is corroborated by the Post Slide Geometry which clearly shows the shape of the sliding mass. Most prominent is the spoon shaped configuration that is typical of Rotational Slides in soils.
(5) Creep and Elastic Heave
Cherry Hills Subdivision was sited on a massive cut from the crest of a mountain slope. The cuts average about 20 meters plus, based on reconstruction of the terrain prior to the excavations (NAMRIA Map) and its reconciliation with the Site Development Plan by using GPS spot elevations.
Such large volumes removed (overburden relief) could induce elastic heave and subsequent creep on the remaining subgrade.
Particularly, because the rocks are intensely fractured, the large overburden relief resulted in removal of confining stress which could have allowed elastic heave in the rock.
This was further aggravated by the presence of creep in the general subdivision platform area.
That creep was taking place is strongly supported by reported cracking and disturbances in the residential units experienced even several months before the slide. Interviews with residents clearly indicated that cracking of walls of houses and observed difficulties in closing windows and doors have been occurring months before the landslide.
(6) Unfavorable 8º Dip to SW
The Bedrock stratification pattern as confirmed by MGB Geologists indicated an unfavorable 8º Dip to the SW, of the bedding planes of the sedimentary rocks (Sandstone and Siltstone).
The slide originated from the Eastern slope and nearly followed the general SW direction of the Dip of the bedding planes.
The highly unfavorable situation probably also induced creep on the subdivision platform bedrock. Due to this unfavorable Dip towards Cherry Hills, the platform rocks were subjected to compressional forces even well ahead of the main landslide event thus causing creep and the consequent problems experienced in some of the houses in the subdivision. The presence of impermeable siltstone bands also probably contributed to the increased heaving because of the buildup in pore pressure underneath these impermeable bands. This condition could further contribute to heaving and further destabilization in the critical hours before the landslide.
(7) Intervention by Man
Destabilization of the slopes in the Cherry hills area started soon after the large cuts made in the quarrying operations prior to subdivision development. The natural drainage pattern was altered. Loss of lateral support of the slope and the existence of a steep nearly vertical slope face removed the buttressing effect of surrounding ground making the slopes inherently weakened and for joints to open up. In addition, the natural gully at the back of the slope was suspected to have been filled up with spoils from the excavations which could have ponded water. However, this could not be verified. The large unsupported cuts allowed the fractures to further open up later on to allow destabilizing factors to come in.
7. CONCLUSIONS FROM THE INVESTIGATION
(1) General
In the three days, August 1, 2 & 3 immediately preceding the landslide of August 3, 1999, record rainfall levels were experienced with the highest level of 500 mm occurring on August 2, 1999.
With the record level of rainfall, development of near full Hydrostatic Pore Pressure was possible. The diversion or blocking of intermittent and continuous surface streams by the landslide movement can add surface water (which originally flowed elsewhere) to the groundwater in the slide area.
These combined with the intensely fractured rocks and already weakened rocks to initiate the landslide.
The confluence of these seemingly unrelated and unfortunate events was therefore responsible for the landslide. Prolonged water saturation and subsequent pore pressure buildup was the final blow that triggered the landslide.
As borne out by the foregoing studies and findings, no single factor could have exclusively caused this landslide and it had to take several events and factors (geologic, environmental, human) to meet, in the slopes of Cherry Hills, to cause the slide.
(2) Summary of Findings
The findings of the Committee are as follows:
Water saturation of the slope triggered the main slide although creep was already suspected to be occurring over time well before the main slide.
The slide that occurred at Cherry Hills on the night of 03 August 1999 was a compound slide made up of a slump and a rotational component.
The lateral and vertical deformation of several roadways near the NE quadrant of the subdivision was caused by a separate although associated mass slumping to the North.
The rotational component towards the East to West direction was the main slide mechanism although this could have been preceeded or currently with a minor shallow slide at the toe of the slope.
Corollary slides (Debris and Mudflow) occurred in the North and South gullies with the latter being more massive in terms of volume of earth and debris that were displaced.
Creep which was ongoing very much earlier than the slide, contributed to the weakening of the subdivision platform shallow layer causing it to fold beyond the toe of the main slide in accordion like fashion when the main slide occurred.
Not one, but several factors or influences coming together caused the landslide.
(3) Recommended Directions for Future Studies
The actual location of the slip plane needs to be further verified in addition to the limited Borings that were undertaken.
Seismic refraction equipment could be employed to map the subsurface and detect the stratigraphy and the shear zone in order to verify the conclusions made in this study.
REFERENCES
1) Wyllie, D. “Foundation on Rock”, page 64, 1st Ed Chapman Hall, London, 1992
2) Goodman, R.E. “Introduction to Rock Mechanics”, 2nd Ed., John Wiley & Sons, N.Y., N.Y. 1989, pp. 43 to 46.