EMILIO M. MORALES, MSCE 1] Chairman, PICE and ASEP Geotechnical Division
SYNOPSIS: A portion of the transverse Dike Spillway No. 3 was breached on August 3, 1996. The failure resulted in a break of about 67 meters of this Spillway, which is one of the 3 Spillways in the Transverse Dike of the Megadike System for the Pasig Potrero River. The Mega Dike System is an emergency dike designed to control the flow of Lahar into outlying towns and the capital city of San Fernando, Pampanga. Many theories and scholarly studies on the cause/s of failure have been brought forward as a consequence of this accident. This paper is a result of an investigation conducted by the author based on an ocular inspection of the site days after the incident, studies of photographs and field reports and conduct of various Engineering analyses in order to determine the probable cause of failure.
1.0 INTRODUCTION
Within a week after the breaching of Spillway No. 3 of the Transverse Dike in Pampanga, the author visited the site to investigate firsthand what caused the breaching from a Forensic Engineering point of view. Several other corroborating photographs were also obtained from various sources as well as data from various references.
This paper attempts to study the failure mechanism based on a broader study and engineering analyses in order to identify the specific and most likely cause of the breaching of the Spillway. No attempt has been made to pinpoint the blame on any person/s or entity. The results of the investigation are based on factual data and sound engineering principles.
In the investigation process undertaken, all possible failure mechanisms were studied resulting in the elimination of some, as not having contributed to the failure.
The study was a result of a long-term effort to gather information from various sources as well as the study of post failure evidence, mainly from engineering analyses, photographs of the relic structures and the debris. Engineering Calculations were performed to verify adequacy of the Transverse Dike structure as designed when subjected to the flood level encountered at failure.
2.0 BACKGROUND
The Transverse Dike system is a concrete faced embankment dike structure constructed perpendicular to the East and West Lateral Dikes of the Mega Dike System designed to control the flow of Lahar along the Pasig-Potrero River system.
The Mega Dike system, of which the Transverse Dike is a component, is an emergency structure to block the massive inflow of Lahar along the Pasig Potrero River estimated to be about 50M cu.m. The purpose of the Lateral Dikes is to prevent the spread of Lahar to the cities of Angeles and San Fernando and the towns of Bacolor, Guagua and Sto. Tomas.
The Transverse Dike system was designed to control massive flood flows and Lahar by creating a sedimentation basin formed by the East and West Lateral Dikes with the Transverse Dike serving as closure.
The Transverse Dike serves several purposes: ⦁ Contain Lahar sediments ⦁ Reduce the volume of water and Lahar flows downstream of the Transverse Dike ⦁ Reduce the velocity of flood waters
Three (3) Spillway Structures (Spillway 1, 2 & 3) were provided for the Transverse Dike of identical design. However, several contractors and subcontractors were involved at one time or another in the construction of the Spillways and the Transverse Dike in general.
(1) Technical Description of the Transverse Dike:
Length (East-West) – approx. 3 kms.
Base width – 41 meters
Crest width – 4 meters
Spillway height – 9 meters
Downstream Apron – 15 meters
The Upstream and Downstream faces were protected with an R.C. facing 150mm and 250mm thick respectively. The R.C. Apron is provided with a 2.6 meter and 1.0 meter concrete vertical face intended as a seepage barrier.
The Spillways were provided with 3 rows of Drain Pipes arranged in 7 columns. The original design called for steel pipes for all the 3 rows. However, during construction, the lowest row was substituted by large diameter R.C. Pipes. This decision became a critical factor in the investigation.
(2) The Spillway Failure Event
At around 1:00 p.m. of August 3, 1996, failure of the Dike System occurred. By 3:00 p.m. a 67 meter portion of the Transverse Dike had been washed out, totally, removing pipe columns 2, 3 & 4 and leaving column 1 on the West and columns 5, 6 & 7 to the East.
It was reported that the failure was preceded on August 1, 1996 by an earthquake of Magnitude 5.8. No damage was reported immediately after the earthquake or on August 2, 1996.
Eyewitness accounts immediately prior to the breaching of the Transverse Dike indicated that leaks started appearing in the concrete armor facing followed by sudden upward tilting of the pipes and progressive failure within 2 hours. A study of the site by the Author, and as recorded in photographs generally concurred with eyewitness accounts as R.C. pipes which were left, were tilted upward at the outlet end and downwards inside the dike core.
What caused the failure?
This paper seeks to unravel the mystery and in the process identify the failure mechanism based on investigation of all possible scenarios that could cause the failure or contribute to such failure.
(3) Investigative Study
This study got started almost within a week from the failure as the author visited the site to inspect the failure debris and study the remnant or relic structures that were left after the breaching. This included going inside the cavernous void inside the remnant of the dike where the pipes were located. Discussions at site during the inspection were made with various DPWH personnel as well as locals who were spectators to the incident.
Photos were also taken or obtained from various sources during the course of the investigation leading to this report.
As earlier indicated, the investigation covered all major possible cause/s for failure namely:
Design
Seepage
Piping
Slope Stability
Structural adequacy of Downstream RC Facing
Construction Details and Quality
Ocular Site inspection at time of incident
Inspection of RC Pipe Construction Details
Inspection of Dike RC Facing
Study of DPWH Plans
These were aided by information gathered, more particularly photographs, taken at the failure site after the breaching. These photographs served as important pieces of the puzzle in the Engineering Investigation and study conducted.
3.0 INVESTIGATION DESIGN
The investigation and Engineering analyses conducted were based on the plans and details of the spillway dike. The analyses procedures were done in accordance with standard engineering practice in the investigation of failures. In addition, parallel computational procedures were used whenever possible in order to check on the results, particularly in the very critical analysis of seepage effects.
The Engineering analyses were conducted on the following critical aspects of the Investigation of the design in the order of importance as relates to the Failure analysis:
⦁ Seepage Analysis using conventional Flownets and Finite Element analysis using SEEP2D Software. ⦁ Piping analysis by evaluation of the Critical Gradient ( icrit )and Average Gradient (iave ) at the Toe of the Dike Structure. ⦁ Slope Stability Analysis using SLOPE/W Finite Element Analysis software. ⦁ Structural Analysis of the RC Downstream Facing using STAAD Software.
All of the foregoing Computer Softwares used are universally accepted software commonly used by the Engineering profession. The results and input codes may be obtained from the author upon request.
(1) DESIGN PARAMETERS USED IN THE DESIGN INVESTIGATION
In the investigation of the design, the design parameters used were gathered independent of the design done by others. The parameters selected, particularly the soil properties used in the seepage analysis and Dike stability analysis were obtained from literature and various references.
As in any Failure investigation, the Analyses Parameters selected tended to be on the low side, in order to be conservative in the investigative results.
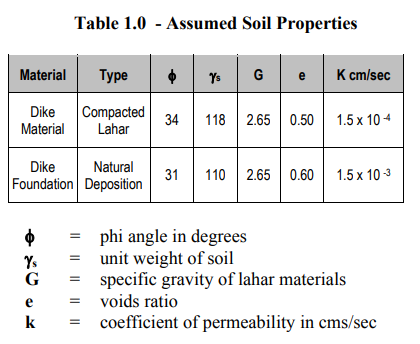
The table below summarizes the physical properties of materials used in this study.
To simplify the seepage analyses, the foundation material was considered to be fairly homogeneous down to the depth of interest for the seepage and stability analyses. Again, this would be on the conservative side as the density of underlying lahar sands at site were generally increasing with depth.
(2) SEEPAGE ANALYSIS
The seepage analyses were conducted using the universally accepted conventional Flownet Analysis2], which is a graphical presentation of flux or flow of a liquid or an electrical current in a field from a region of higher potential to a region of lower potential.
In turn, a 2D Finite Element Analysis using SEEP2D Seepage analysis software and its Graphical Pre and Post processor FASTSEEP were used to verify the results of the Flownet Analysis.
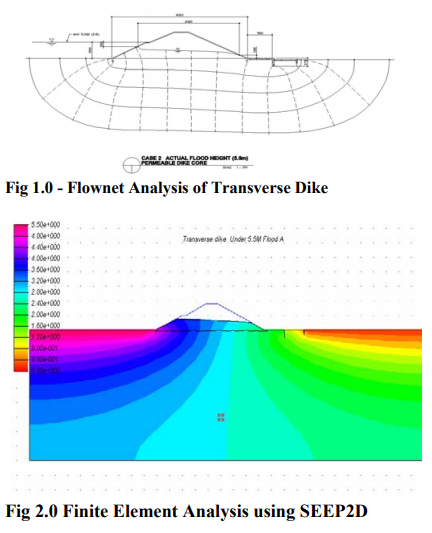
The figures below represent the Flownet and Finite Element computer analysis of the seepage condition at the time of failure when the floodwaters rose to 5.5 meters or about 3.5 meters from the Spillway Crest.
The above figures show striking similarity and agreement with each other and generally confirm correctness of the results of the two independent analytical procedures. The results clearly indicate that no detrimental seepage pressures could result from the floodwaters rising to 5.5 meters nor could harmful heave forces be generated underneath the base of the transverse Dike spillway structure.
A closer study of the flow diagrams in both figures show a hydrodynamic lag in the rise of the phreatic surface inside the Dike core as a result of the upstream concrete facing serving as an impermeable blanket or barrier. This was generally anticipated and the seepage analyses results show the positive effect of the upstream and downstream RC Facing or Blanket.
From this, it was also possible to calculate the resulting hydrostatic pressure on the downstream facing for analysis of its structural adequacy.
An analysis of the heave pressures developed at the base of the Spillway Dike, as the floodwaters rose, was also performed to determine whether heaving of the Dike core was likely.
The results of the calculations (included in Appendix “A”) indicate that the dike design would be adequate to sustain the seepage forces as well as heave at time of failure
(3) PIPING ANALYSIS
Piping is a physical phenomenon, which results in a “quick” condition; terms normally used to describe a “quick” condition are “sandboil” and “quicksand”.
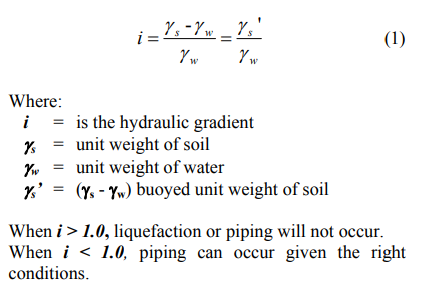
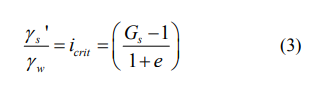
Piping occurs when the buoyed unit weight of the soil γs’ is less than or equal to the seepage force acting in an upward direction. As a consequence, the effective stress becomes zero and the soil is floated and disaggregated resulting in a “liquefaction” effect.
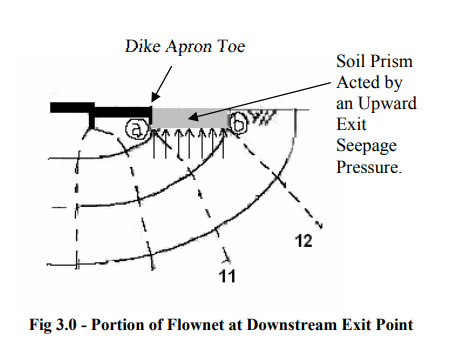
Normally, piping occurs at the downstream toe of the Dike or Dike system when the exit gradient is relatively high and where the total weight of the soil column resisting the seepage force is at a minimum compared elsewhere in the Dike section. The piping then progresses inward to cause a tunneling effect, which can undermine the stability of a dike or a dam.
Piping can also occur within a dam base, particularly when the seepage velocity is relatively high or in the presence of highly permeable gravel formations as to carry fine particles downstream. However, and as verified from the SEEP2D analyses, the seepage velocities were very low due to the relatively low permeability of the Lahar sands (classified as Silty sand) and Borings did not indicate any gravel formation of any significance to the study.
At the critical liquefaction state, this condition is expressed in the following soil mechanics phase relations equation:
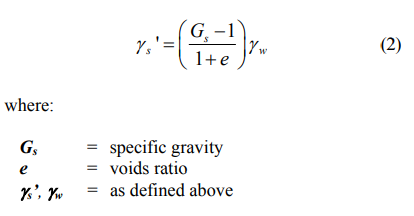
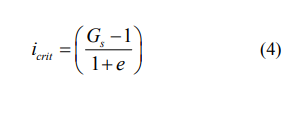
Thus, for this condition, the resulting gradient is defined as the critical Hydraulic Gradient icrit. From phase relationship of soils:
Therefore, substituting in equation (1):
Thus:
In the design of hydraulic structures, it is very important to ensure that the critical hydraulic gradient icrit is not reached through careful selection of materials (to obtain higher Specific gravity of the soil Gs and/or compaction in order to decrease the voids ratio e).
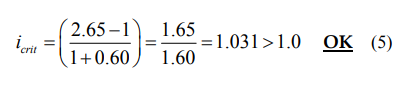
Using the foregoing assumed soil properties in Table 1.0 we determine the critical hydraulic gradient as:
Thus, the value of icrit: is greater than 1.0 and is thus acceptable. To further determine the factor of safety against piping it would be necessary to obtain the seepage forces acting upward against an element of soil at the downstream toe from the flownet of Fig. 1.0.
Between the equipotential drops ND=11 and ND=12, the heads are (see Appendix “”A”). N11 = 0.846m; N12 = 0.423m; The distance a-b is 7.0m (scaled)
Thus,
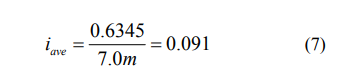
The hydraulic gradient acting upward against the soil element 7.0 meters wide is;
The factor of safety against piping is;
From the above, it can be shown that the Dike structure is safe against piping.
(4) STRUCTURAL INVESTIGATION OF D.S. RC FACING
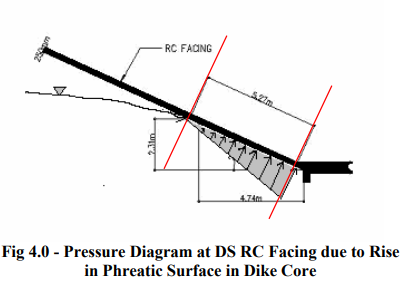
The only other possible cause of the breaching from a Design point of view, is if the downstream armor facing failed due to hydrostatic pressure build-up inside the core as a result of rise in the phreatic surface. Such damage could allow fines to be washed out through the facing and thus internally collapse the dam. For the given flood condition, this can only occur at the bottom 3 meters of the downstream facing.
At the flood condition of 5.5m, the resulting phreatic table elevation at the back of the downstream facing is about 2.31m as computed from the SEEP2D Finite Element Analysis.
The downstream reinforced concrete facing is a 250mm thick concrete mat reinforced both ways by 12mm ø rebars at 300mm o.c. both ways.
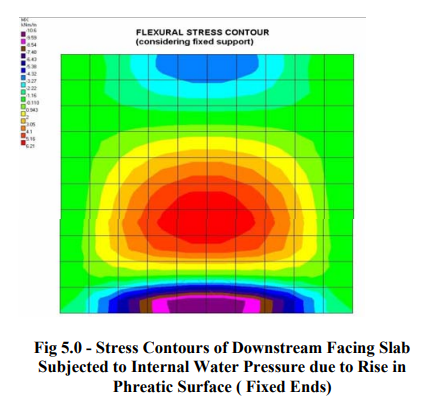
In order to determine the force at the back of the downstream facing, the following condition was modeled using the portion of the RC Facing subjected to Hydrostatic pressure as a 5.27 meter square plate fixed or fully restrained at all edges or a plate that is pinned on all sides:
These two support conditions represent the upper and lower extremes insofar as support condition is concerned. The assumption of a 5.27m span is a very conservative assumption since probably a shorter slab span would be more realistic. The slab was analyzed as a flat plate acted on by a triangularly varying load. The condition of fully restrained (fixed) and Pinned conditions were used on a 5.27m square plate dimension.
Thus, it can be seen that even at the Pinned condition, the facing is only 20% overstressed and is very safe using a full Fixed condition.
The truly realistic condition would be somewhere in between these two support conditions that would render the facing safe for the flood condition, not to mention the very conservative large slab span assumed.
From the foregoing, we can conclude that the R.C. facing did not fail from the hydrostatic pressure developed inside the Dike Core.
(5) SLOPE STABILITY ANALYSIS
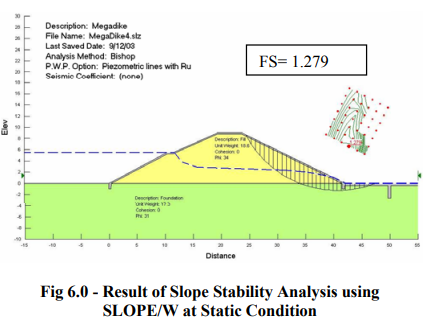
A two-dimensional slope stability analysis of the Dike core was performed using SLOPE/W, one of the more popular slope stability analyses program used worldwide by Geotechnical Engineers.
The results were obtained from analyses of the Dike stability both at failure condition (5.5m) and due to earthquake.
The slope stability analysis results indicated that the Dike is safe at static condition with a Factor of Safety (FS) equal to 1.279.
Earthquake loading was considered in the analysis corresponding to a 5.8 Magnitude Earthquake coincident with the flood level of 5.5M Flood as a purely academic exercise. The results show that the dike is marginally safe (FS=0.989) for combined earthquake and flood level of 5.5 meters, which is an unlikely combination.
(6) HEAVE ANALYSIS
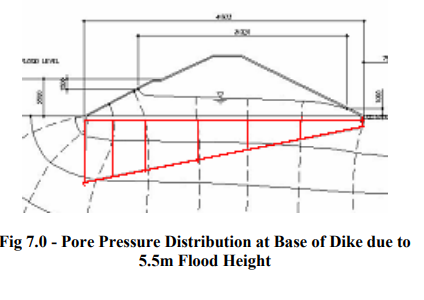
From the Flownet analysis, the equipotential lines intersecting the base of the dike are converted to upward pressure. This pressure tends to heave the dike and is only counteracted by the weight of the Dike Structure.
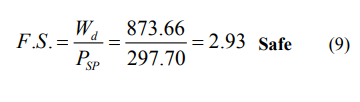
The analysis and results are shown below: Wd = Weight of Dike = 873.66 kips PSP Total upward Force at Base = 297.7 kips
(7) SUMMARY OF FINDINGS IN THE INVESTIGATION OF THE DIKE DESIGN
From the foregoing, we can summarize the findings resulting from the investigation of the Design as follows:
Seepage Analysis – Safe F.S. against Piping – 11.32 very adequate F.S. against Heave – 2.93
Dike Stability (Slope Stability) F.S. Static Condition – 1.279 adequate F.S. Seismic Condition – 0.989 OK (see Discussion)
Slope R.C. Facing DS R.C. Facing Slab structurally adequate against buildup of hydrostatic pressure for Flood level Failure.
Thus, it can be concluded that the Dike design was adequate for the Conditions at the time of failure.
4.0 INVESTIGATION OF CONSTRUCTION DETAILS
The author considers that the best way to present the bases for this portion of the investigation is to present these in photographs taken after the failure, coupled with corresponding observations and commentaries of the author based on his ocular inspection at site and reviews of various reports.
From these, and by elimination, conclusions can be formed as to whether any of the feature/s have contributed or not to the Failure in the same way that the Investigation of the design was carried out in the first part of this paper.
(1) BACKGROUND
The original construction called for the installation of 3 rows of relief pipes in 7 columns for each of the 3 Spillways.
These relief pipes were designed to allow water and lahar in suspension to be drained to reduce buildup of hydrostatic pressure at the upstream side during normal flows. Eventually each layer of pipe will be naturally deactivated by the buildup of sediment at the upstream side, effectively blocking the flow. These pipes were originally specified to be all steel pipes.
Sometime during construction, a field change was made by substituting large diameter R.C. Pipes at the bottom row for the steel pipes originally specified as the specified diameter steel pipes were not readily available in the market. This change was implemented in the final construction.
Prior to the failure, it was reported that all the R.C. pipes in the lowermost row stopped flowing. Eyewitness accounts gathered from various reports indicated that although at the downstream end the flow was completely stopped, there was rapid intake forming a whirlpool at the upstream pipe intake, followed by cracking of the downstream R.C. Facing and seepage coming out through the cracks and eventually by massive collapse.
Photographs taken at the site corroborate these observations.
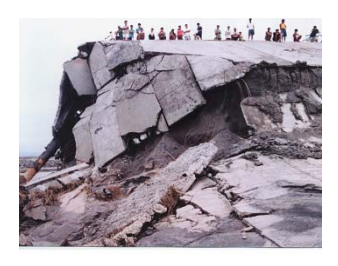
The picture below shows what remained of the spillway after a 67 meter section was breached. A closer look at this photo, looking West, shows that the Dike core was internally eroded with the Downstream and upstream armor RC facing collapsing into the core.
The subsequent photos will explain why and how this happened.
(2) R.C. PIPES
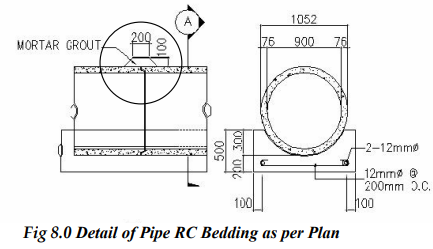
The R.C. Pipes are 900 mm Ø x 1.0 meter long. These were designed to be bedded or laid on a Reinforced Concrete Bedding in turn resting on a well compacted subgrade composed of dike core materials shown in the revised project plans and sketched here below as Fig. 8.0.
The detail above shows that the bedding concrete is to be reinforced by 2-16 mm Longitudinal rebars and 12 mm transverse ties at 200 mm on centers.
Also, the dimensions of the pipe Mortar Grout are shown to be 200 mm wide and 100 mm thick tapering at the ends.
The subsequent photographs show critical deviations from the above requirements as contained in the plans as follows:
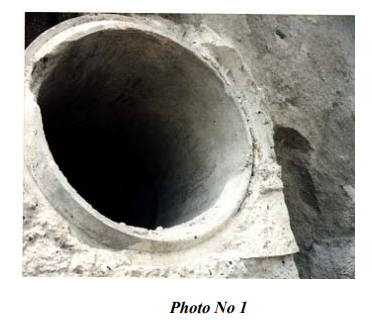
Photo No 1 clearly shows the absence of rebars on the bedding concrete. The bedding has completely sheared off at the joint allowing massive inflows inside the Dike Core creating the massive caverns shown in the subsequent photos. Note that the mortar grout had been removed at one side.
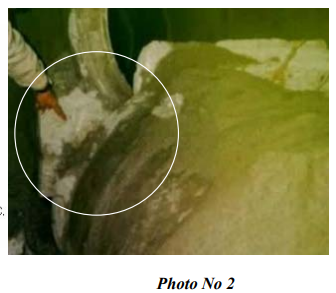
Photo No 2 also shows the same absence of rebars in the supposed to be reinforced Concrete bedding. As can be noted, most of the pipe breakages were at the critical pipe joints where the pipe is weakest. However, total collapse and full breakage of the pipe joints could have been prevented or minimized if the concrete bedding reinforcement had been placed in accordance with the plans and details…………………
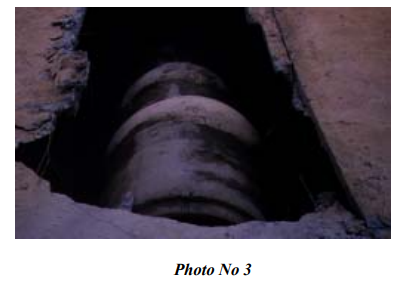
Photo No 3 shows that the Mortar grout that was placed when compared to the scale of the pipe indicates that the mortar grout dimensions specified in the plans were not followed. Also, note that the thickness of the Mortar grout at the top of the pipe is very much different only at a short distance away from the top along the sides. Why this is so is not clear to this investigator.
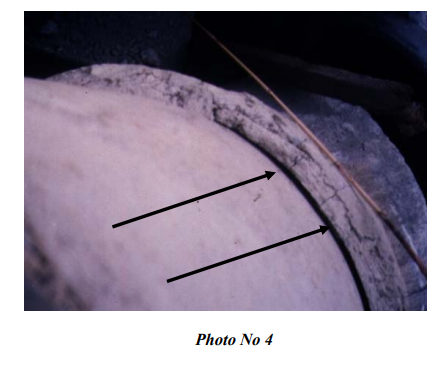
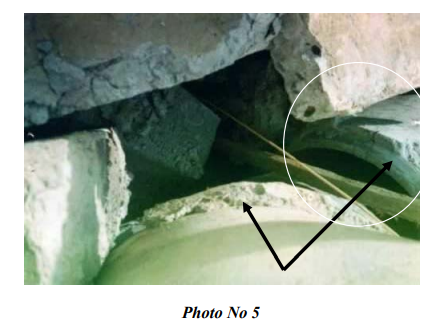
These photographs (Nos 4 & 5) show the poor quality of the mortar grout. Note the gap that was neatly debonded from the pipe body in Photo No 4. Although not clearly discernible in this photo, the mortar grout is relatively less than the 100 mm thickness specified in the plans.
Photo No 5 more clearly illustrates the quality of the Mortar grout as laid and its actual thickness.
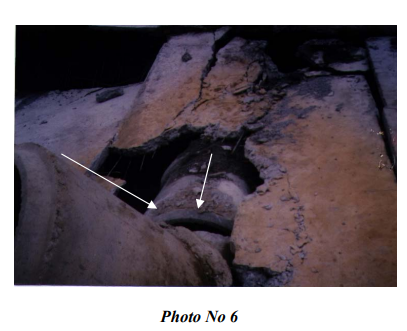
This photo No 6 shows the pipes tilted upward as it daylights at the outlet end downstream. The armor facing has collapsed inward. Also to be noted in this photo is the cavity formed underneath the facing and alongside the pipes.
The pipe tilted inward indicates that internal collapse occurred rather than an outward failure that could have been caused by excessive build-up of pressure inside the dike core otherwise, the pipes could have been pushed downward and out.
This clearly suggests that undermining from internal erosion caused by Internal leaks along the pipe joints was the most probable cause. These leaks which became critical as the leaks progressively got bigger eventually led to the critical breakage of the unreinforced concrete bedding at the pipe joints causing massive pressurized flows inside the dike core.
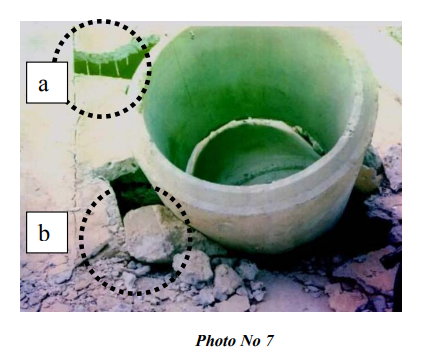
This photo No 7 shows the pipes also tilted upward at the outlet end downstream as in previous photo No 5. The pipe inside also shows undermining of support more clearly visible in the previous Photos ( Photo No 3 & 6) above.
Note the cavity in the background (Inset “a”) and the location of the rebar of the armor facing relative to the facing thickness. Inset “b” also again shows the absence of rebars in a remnant of the bedding concrete that is still partially attached to the RC pipe.
All of the foregoing photographs show significant deviation from the plans and/or good construction practice in three critical requirements:
Lack of longitudinal and transverse reinforcing bars for the RC Bedding.
Inadequately sized mortar joint details
Poor Quality of Construction
The foregoing deviations clearly have a significant role to play in the failure that ensued. It is only a matter of tying the pieces together to establish the Failure mechanism that caused the breaching of the Spillway No 3 of the Transverse Dike.
(3) DOWNSTREAM RC ARMOR FACING
The second element of the dike to be investigated was the Reinforced concrete armor Facing at the downstream side.
The plans and details of the transverse Spillway Dike called for a 250 mm thick RC Facing reinforced by 12 mm rebars at 300 mm on centers both ways. The details show that the rebars are to be placed at the middle of the RC Facing thickness.
The following photographs show evidence that the rebar placement was different from that specified in the plans.
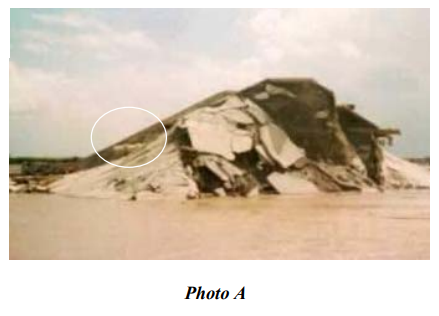
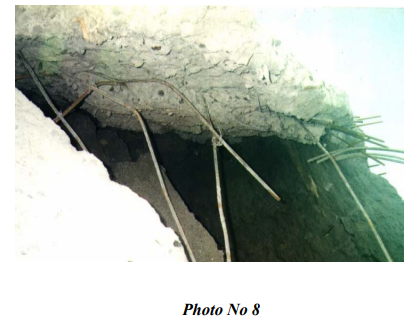
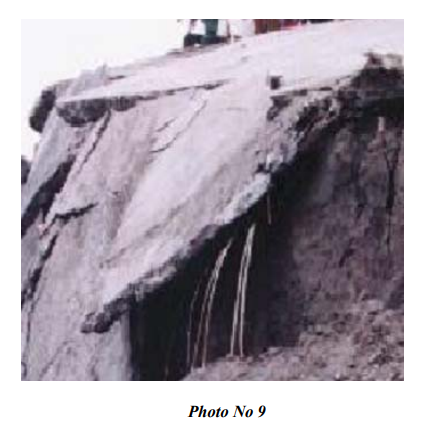
Photo No 8 show the rebars as laid out in the actual construction. The rebars are all at the bottom or nearly at the bottom of the RC Facing where it is ineffective in resisting lateral forces from internal water pressure. Our structural analyses indicated ( See section 4 pages 5-6 ) that if the rebars have been correctly placed in the middle, the facing slab would have been adequate to sustain the lateral pressure buildup due to the rise in the phreatic surface inside the dike core. No analysis is required to show that the facing concrete would fail once the tensile capacity of the Concrete (which is very minimal) is reached. This explains the disintegration of the concrete facing as can be seen in Photo A.
This photo shows the rebars debonded from the RC Facing . The picture also show that the rebars were not placed in the middle of the Facing but rather at the bottom portion of the slab where it is ineffective in “reinforcing” the concrete facing.
The wrong placement of rebars is also seen clearly in Photo No 7.
(4) SUMMARY OF FINDINGS ON CONSTRUCTION DETAILS
The foregoing photographs (Photo 1 to 9) established the following major deviations from the plans:
The Mortar grout dimensions and quality did not comply with the plans and standards of construction.
The RC Bedding did not have any reinforcement at all.
The RC Facing at the downstream side of the dike had the rebars laid at the bottom of very near bottom of the Facing slab where it was ineffective in resisting outward pressures from the build-up in the phreatic surface within the core of the dike.
These significant departures from the plans and quality standards have a role to play in the Failure mechanism that could be pieced together from the failure event as well as the study of the remnant or relic structures and failure debris.
Taken individually, the following are the contributions to the Failure mechanism:
The inadequate mortar grouts allowed leaks at the joints causing progressive erosion and cavitations within the Dike core.
The unreinforced pipe bedding gave way by completely shearing at the joint as the subgrade support is eroded by leaks. This in turn caused a major pipe breakage stopping the flow completely at the outfall end (as observed by eyewitnesses immediately prior to failure) and discharging the full pipe flow within the dike core. This in turn increased the hydrostatic head within the dike core to the available head at the upstream (5.5 m). The pressure build-up induced lateral pressure on the RC Facing. The pipe breakage caused the full discharge of the pipes under a 5.5 m head to internally erode the dike core causing further breakages in other pipes and forming huge cavities inside.
The wrong placement of the rebars (Nearly at the Bottom of Facing ) gave the facing very minimal flexural resistance against the outward lateral pressure build-up causing failure of the concrete in tension and in places completely debonding the reinforcement from the concrete slab. This explains the breakup of the facing into small slab panels as shown below ( see also Photo “A” ):
It is possible, although there is no proof to substantiate this, that the Earthquake of August 1, 1996 caused the initial dislodgement of the RC pipes or debonding of the poorly constructed joints as to trigger the initial leakage which became a massive flow when the pipes sheared at the joints.
However, even without such disturbance, leaks are likely to occur in the poorly constructed joints and weak bedding support, that could lead to similar failures as has occurred.
Thus, the likely failure mechanism is as described above. This is supported in turn by several other observations as described below:
The RC pipes at the outfall ends were tilted upward suggesting internal collapse.
The RC Facing slabs have dished in inward suggesting internal collapse of the Dike core.
4.0 CONCLUSIONS
The results of the Engineering investigation as supported by engineering analyses and calculations, indicate that the Transverse Dike Spillway design was adequate for the conditions encountered at failure and that no detrimental seepage condition could likely form as to cause failure. The possibility of collapse due to Piping also can be ruled out. The Engineering analysis of the piping at the downstream end indicates that the critical Gradient is adequate and cannot be overcome by the upward seepage gradient.
The same cannot be said of the construction details as uncovered during this investigation from ocular observations done by the author, from photographs taken after the failure and from corroborative eyewitness accounts as documented in various reports.
The Transverse dike failure can only be directly attributed to internal erosion within the dike core, which could have only been caused, initially by a leak or leaks in the pipe joints followed by massive discharge after the leaks have undermined the pipe supports, causing the pipes to fail at the joints. This conclusion is backed up by corroborative description of what happened immediately before the failure as contained in various investigation reports and also by the photographs contained in this paper.
5.0 LESSONS LEARNED
The engineering profession and the Construction Industry can learn a lot from such investigations of failures. It allows us to look back at our mistakes so that they would not be repeated in the future. In addition careful attention to seemingly unimportant details in normal construction become critically important when used for other more critical structures.
Clear departure from the plans by the omission of rebars in the bedding concrete could have been easily detected during construction, with adequate quality control and supervision.
A case in point is the mortar grout for RC Pipes. Whereas minor leaks do not become evident or are tolerable in drainage pipes which are normally not flowing full or not under full head, such leaks within a 9.0- meter earthen dike embankment could really be disastrous as proven by this incident.
The absence of care in the laying of the reinforcement for RC Facing, clearly evident in this incident, should not have happened with proper care and adequate superintendence.
1] Emilio M. Morales MSCE – Master of Science in Civil Engineering, Carnegie Mellon University, Pittsburgh, PA, USA, Doctoral Student, Asian Institute of Technology, Chairman, PICE and ASEP Geotechnical Committees, Principal EM2A Partners & Co., Formerly Senior lecturer in Soil Mechanics and Foundation Engineering, Graduate Division, School of Civil Engineering, University of the Philippines, Chairman joint PICE/ASEP investigation team for Cherry Hills Landslide.
2] A 2D Finite Element Seepage Computer program developed at Brigham Young University, Provo, UTAH.
The design of girder to column joints have evolved over the years but essentially done by following standard prequalified details such as the ones published in the ASEP Guide 1991 3 for standard Butt-welded Beam/Girder to Column Joints. This joint is now known universally as the “Type 1 Joint” in contrast to other joint types, which have been proposed to replace it.
But why was there a need to replace this Joint detail as proposed by respected US Technological Associations involved in Earthquake Engineering and Research even as early as 1994? Also, why does this detail keep on recurring in Building designs here in our country?
These questions and the reasons why this Type 1 joint should be replaced is the topic of this Paper. It is hoped that the Local Engineering profession or some fellow practitioners who are not aware of the problem associated with this detail would be able to understand the compelling need to change their details. In addition, it is hoped that ASEP would take the lead and issue a circular “outlawing” this joint for use in seismic detailing and withdraw this detail in the outdated 1991 Guide.
1.0 Introduction
As soon as the findings of the Northridge Earthquake of 1994 became common knowledge in the Engineering community both locally and abroad, serious questions have arose regarding the highly critical vulnerability of the Traditional Type 1 or the Butt-welded Beam/Girder to Column Joint in structural Steel construction. It was found out that significant failures occurred in localized regions of the joint and column flanges, which required very costly repairs. As a result, some buildings in California that otherwise appeared safe (At least in external appearance), had to be razed because of the uneconomic cost of repairs entailed by damage sustained by this Type 1 joint.
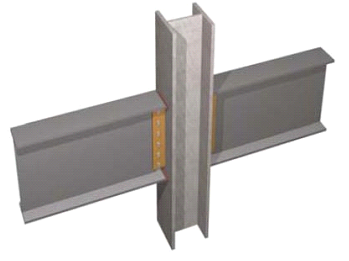
This Joint Type is illustrated below in 3D rendering taken from Ref 6] and shows the connection detail where the Beam or Girder Flanges and the web are butt-welded to the column Flange. The Column may or may not be reinforced with web stiffeners.
(a) Type 1 “traditional” moment connection
Consultants who kept abreast of the State-of- Practice quickly abandoned this detail and adopted the Official recommendations published by various research organizations such as the SAC Committee 4
However, and surprisingly as we have observed in the local Engineering community, some design houses were still very slow to adopt or have continued the use of the highly vulnerable Traditional Type 1 joint detail despite almost 10 years since this joint was removed from the recommended details.
Why this poor state of affairs? Partially this is to be blamed on the lack of knowledge and information on developments in the structural engineering field due to lack of funds for keeping abreast of the state-of practice and/or lack of interest. Also, this could be partly because the ASEP 5] has not superseded the 1991 Guide which contained this originally “recommended” but otherwise banned Traditional Type 1 joint detail.
However, both these two situations are not acceptable excuses particularly nowadays because of the easy access to FREE technical information from the Internet where most of the materials in this Paper have been obtained.
This problem, which prompted the writing of this paper, became glaringly evident when our office was asked recently to do a value engineering study for a 5-Storey structural steel commercial building, which was already in the bidding pipeline.
Aside from our findings that the building was over designed by as much as 30 to 40% for the primary structural framing system, ironically, failure could still ensue despite the over design due to the highly vulnerable Traditional Type 1 joint detail provided in the plans. To compound the problem, the building was long but narrow in plan and required a column free interior. This resulted in dependence on only two column rows leaving no alternative stress paths. Thus a domino type collapse is possible with a failure in one of the joints as the girder spans are relatively large at 15 meters.
1.1 The ASEP Guide “ Earthquake Resistant Design of Structures” 1991 Edition 6]
The ASEP Guide “ Earthquake Resistant Design of Structures” 1991 Edition contained in Chapter 4 “Recommended Structural Detailing Practices” the Traditional Type 1 joint detail as connection Detail 4.29 on page 182.
In addition, page 178 of the same Guide required a Column to Girder Strength Ratio of 1.25. While this requirement could promote a “Weak Beam Strong Column” (WBSC) approach espoused in later studies, this pre-Northridge Earthquake” provision was not enough to prevent damage to this Type of Joint.
It should be noted that the ASEP Guide was published as the 1991 Edition. The Northridge Earthquake occurred in 1994 or 3 years after this publication. Our recent telephone inquiry with the ASEP Secretariat 7] indicated that this Edition has not been superseded by later publications.
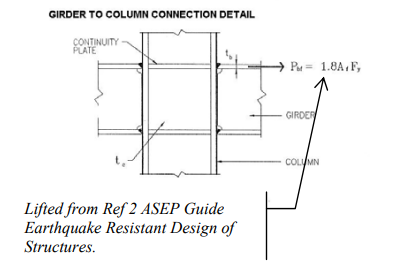
The following detail was lifted from the ASEP Guide 4]
Type 1 Joint in ASEP Guide
2.0 Historical Background
The Northridge earthquake resulted in 57 deaths, more than 5,000 injured and $20 billion in property damages, making it the costliest seismic disaster in U.S. history. Severe structural damage was seen in a wide variety of buildings. The engineering community was specially surprised by the poor performance of the highly regarded and widely used beam-to-column welded connections of Steel Moment Resisting Frames (SMRF).
After the Earthquake of January 17, 1994, a task committee was formed in the USA consisting of the Structural Engineers Association of California (SEAOC), the Applied Technology Council and the California Universities for Research in Earthquake Engineering (CUREE)). Collectively known as the SAC Joint venture Ref 7]. The SAC studied Post earthquake damage effects. A very disturbing or even alarming consequence is the discovery of numerous damages in beam to column Joint connections, which were based on what is now known as the “Traditional Type 1 Connection” for Moment framed joints.
Excerpts from the report are collected herein to shed more light on the criticality of this type of joint.
“Prevailing construction design codes take into account a strong inelastic behavior by the steel structure when exposed to earthquake ground motion. This is why ductile elements and connections are used in the SMRF. Based on research dating back to the 1960’s and previous earthquake experiences the steel frame with moment resisting connections has been considered the most reliable seismic resistance design for low and high-rise buildings. The common usage of welded steel moment resisting frame is also a consequence of its versatility, economy, and its supposed high plastic deformation capacity.
In just 15 seconds, the Northridge Earthquake invalidated historic design approaches and proved wrong the theory of integral ductile response of the welded SMRF. In more than 250 buildings, brittle fractures were discovered in the welded beam-to- column joints. Fortunately not a single building collapsed and no death or injury occurred due to the unexpected mode of failure. The cracks were observed through the beam-to-column welds and/or through the base metal of the beam or column flanges. These cracks resulted in a loss of seismic moment resistance in the damaged connections; however, the connections still transferred gravity loads which may explain why there were no total collapses triggered by the brittle failure of welded joints.”
The Northridge earthquake caused an unexpected brittle failure on welded SMRF constructed conforming to modern building codes and standards of practice. It was proved that those welded SMRF connections did not fulfill the design intent of providing reliability and safety. Research was initiated to improve these connections.
(“The Northridge Earthquake and Welded SMRF “) Anon 3].
3.0 Girder to Column Moment Joint Details
3.1 Traditional Girder Column Joint Detail
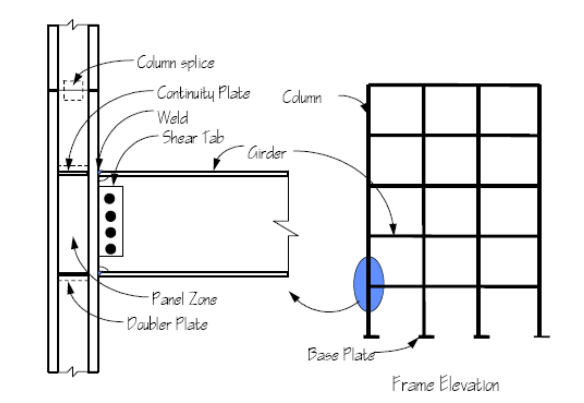
The Figures below, taken from Ref 6] show the various components of the typical “Type 1” Pre Northridge Earthquake Traditional Type 1 Joint connection detail.
Figure 2-1 Elements of Welded Steel Moment Frame
The foregoing is the same detail incorporated in the ASEP Guide “Earthquake Resistant Design of Structures 1991 Ed” unfortunately; this guide has not been replaced nor superseded to reflect the current State of knowledge regarding the problems associated with this connection detail in the light of the Northridge Earthquake experience.
The failures are primarily attributed to a fundamental flaw in the standard code- prescribed welded-flange bolted-web connection and the extreme ground motion at the site. 8]
As would be evident in this report, this type of detail would no longer be acceptable based on current state of practice due to the inherent lack of ductility and propensity for localized failure in the joint panel based on numerous recorded failures of this Type of Joint.
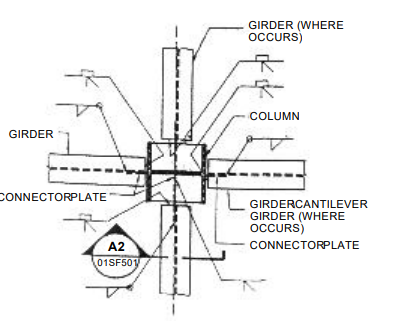
Below is a Detail from a drawing for the 5 Storey Commercial building, which was the subject of the Value Engineering we conducted:
Based on the details as shown above, taken from a scan of the drawings, the following are main features of the Joint detail:
A plug weld is used to weld the Girder flanges supported by a backing bar or spacer directly to the column flanges.
Connection plates (“Stiffener”) at the level of the top and bottom flanges were incorporated within the joint panel as stiffener plates.
The girder web is connected to the column by means of connector plates butt welded to the column using a Vee weld.
The foregoing figure shows that the joint connection details are similar to or identical to joint connection details in use prior to the Northridge Earthquake, which consists essentially of Girders being framed into columns by full welding of the Girder Flanges to the corresponding column Flanges or webs by butt or groove welds. These welds were very much in use pre 1994 until detailed post Northridge Earthquake damage evaluation indicated that something was terribly wrong with these joints.
3.2 Type 1 Joint Failure Mechanism
Simply stated, the problem with the traditional Type 1 Connection is the lack of Ductility in the Panel Joint connection details leading to brittle fractures. However, the crack initiation and propagation mechanism is not as simple. In all cases where the Type 1 joint was examined, failure was at the region of the connection between the top and/or bottom Girder flange/s and the column.
Failure was initiated in all instances by the incomplete fusion flaw as provided by the backing bar and its gap to the column flange. This constitutes a pseudo crack, which becomes a stress raiser during cyclic loading leading to crack initiation.
The open notch tip of the weldment where the backing bar is placed simulates a crack in itself. During cyclic dynamic loading, the crack propagates into the weld metal into the Heat affected zones (HAZ) and unaffected zones.
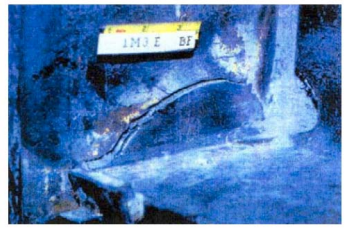
Figure 4. Brittle failure in “traditional” steel frame connection observed after Northridge EarthquakeDamage to Column Very Severe
Researchers have found that the stresses induced in the process although highly localized, are at least one order of magnitude higher than the stresses predicted by elastic analyses. These highly localized overstresses are concentrated at the Girder bottom flange connection within the critical joint panel connection.
This is compounded by the problem that this portion of the joint is the least accessible under field welding conditions thus; the quality of workmanship becomes an issue. This is highly undesirable, as we would not want the failure to initiate at the column or at the critical joint Panel connection as both would exhibit brittle failure modes.
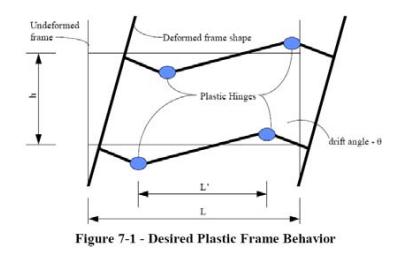
It would be necessary to shift any failure to the connecting Girder (or Beam) away from the Joint. This would ensure that plastic hinging would occur at the Girder to allow flexural yielding rather than a brittle type of Failure. This is the basis for the recommendation Ref 9] to have a “weak beam strong column concept” (WBSC) in order to assure that the failure is not brittle. Providing a weaker beam (relative to column strength) assures that the failure would be that of plastic hinging of the beam, which ensures the extended ductility of the system. Formation of plastic hinges in the beam promotes a “beam sway mode” Failure mechanism, which is preferred over “column hinging”, which could result in more catastrophic collapse modes.
The AISC “Seismic Provisions for Structural Steel Buildings of 1997” Ref 9] for intermediate and special moment frames has adopted the position that:
“For Fully Restrained Connections, yielding must take place in the members of the frame (plastic hinge in beam, panel zone, etc.) and not in the connections.
However, since yielding in the column is the least desirable result, the design engineer should consider designing the system such that flexural yielding occurs in the beam. For FR connections that are part of ordinary moment frames, the connecting elements may yield as long as 0.01 radians of plastic rotation can be provided by the system”
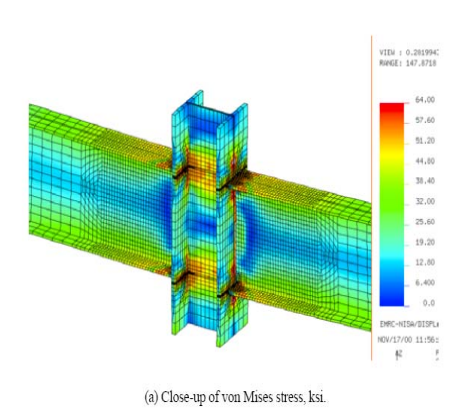
A study of the resulting stresses and strains under repeated cyclic loading of a Type 1 Joint was made as part of the study reported in Ref 6] (See Appendix). The color contour indicate the severe stress and strain concentrations at the Girder flange to column Flange intersections.
The study concluded that:
“The traditional (Type 1) moment connection experienced high-order bi- directional localized plastic strain at the weld root at critical junctures between the girder and column, which is one of the causes of premature brittle fracture. The strain patterns shown in Figure 16 clearly indicate the propensity for this phenomenon. The strain gradient is particularly pronounced at the mid plane of the girder near the weld and weld access hole.”
The study further revealed that:
“Yield stress near the weld access hole and flange weld is exceeded early on in the loading. The strain plots near the weld access hole and flange weld show the stress reversal in the free edge of the girder flange, which is typical for traditional moment connections and a causative factor in fractures initiated from this region of the flange weld. This can potentially lead to fractures either in the flange or, far more critically from the progressive failure perspective, in the column flange. It is primarily this mode of failure that effected moment connection damage in the Northridge earthquake.“
Type 1 Connection Showing Von Mises Stress Contours
3.3 Post Northridge Earthquake Damage Assessment Studies
From these studies it was clearly evident that the “Traditional” Type 1 pre Northridge connection details normally used and espoused by various authorities of that time have failed miserably and at joint locations that are not necessarily the worst stressed member based on post damage reanalysis of the buildings.
In the research done by Mahin S. Ref 3], from the University of California at Berkeley, we quote his findings:
“Comparisons of damage survey data with results of elastic analyses of the buildings (using recorded and simulated Northridge earthquake records developed for the building sites [5]) show relatively poor correlation.
Analyses suggest that the most heavily stressed joints are most likely to be damaged; however, the precise location and severity of damage was notreliably predicted by conventional elastic dynamic analyses. The 60% most highly stressed connections in a structure (relative to their capacities) have roughly equal chance of being damaged. Areas of low computed stress were also subject to damage. Thus, analysis may not be a good way of assessing the particular joints to inspect, though it may indicate floors that should be inspected. The reasons for differences between observed and computed behavior include the effects of initial defects and poor workmanship, and the limitations of current analytical methods and models. For instance, inclusion of slabs and panel zones had an important effect.
Most design calculations are based on an assumption that plane sections remain plane during deformation. However, review of experimental data and results of finite element analyses suggest that this is far from true, with high local bending and shear deformations being induced in beam and column flanges. This is especially pronounced when plastic shearing deformations occur in the panel zone. Results demonstrated that these panel zone deformations were often very large. In such cases, the distribution of shear stress over the depth of the beam’s web is not uniform, often concentrating the majority of the shear force in the highly stressed beam flanges. Compounding this situation is the fact that actual material properties are not uniform, and vary randomly from member to member and systematically with loading direction, section size, and welding procedures. Normal member-to-member variation of material properties may result in members stronger than the connecting weld, or a column that is weaker than the supported beam. As a result, the joint may have negligible inelastic deformation capacity, regardless of workmanship.” (Mahin) Ref 3]
In just 15 seconds, the Northridge Earthquake invalidated historic design approaches and proved wrong the theory of integral ductile re
The Northridge earthquake caused an unexpected brittle failure on welded SMRF constructed conforming to modern building codes and standards of practice. It was proved that those welded SMRF connections did not fulfill the design intent of providing reliability and safety. Research was initiated to improve these connections.
(“The Northridge Earthquake and Welded SMRF “) Anon 3].
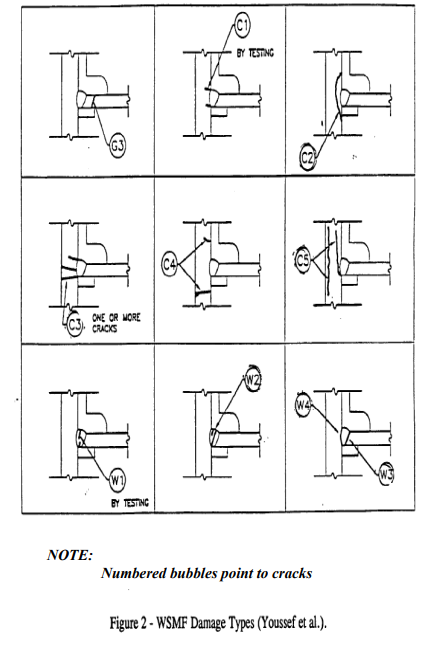
3.4 The Northridge Earthquake and Damage to Beam Column Connections
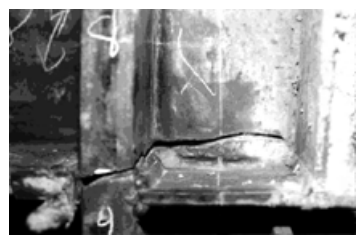
The figure below shows the various types of damage to Joint Panel Connections sustained during the Northridge Earthquake sustained by the Traditional Type 1 Joint Detail after Youssef. (The numbered arrows point to the Cracks)
4.0 Conclusions
Researchers and research establishments in the United States have evaluated several candidate replacement Joint details. Full- scale load tests under cyclic loading were also conducted to determine the response of the various joint details to cyclic loading.
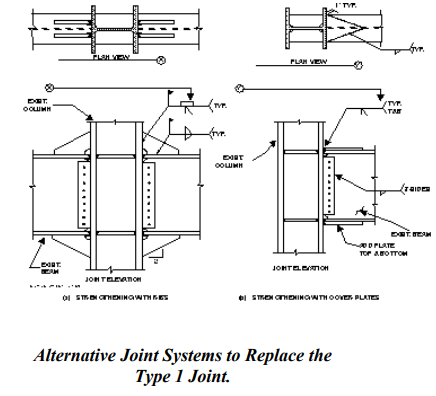
As a result, pre tested details have been evolved and included in the recommendations. Of this, the Type 3 joint shown subsequently has been recommended in addition to other proprietary and nonproprietary joint details.
It is suggested that Engineers who have not done so yet, consider abandoning the Type 1 Joint in favor of the Type 3 Joint in order to correct the potential problems associated with the former.
There are now available prequalified joint details, which could replace the Type 1 Joint. Tests conducted on these alternative details to replace the Type 1 connection have been made and are available in current literature Bjorhovde R. Ref 5] and Houghton ref 6].
Several details have become prequalified as replacement for Type 1 Joints in new construction.
The primary objective is to promote the “weak beam strong column” (WBSC) concept. This is to ensure that initial yielding will initiate at the girder a distance from the Joint and not at the more vulnerable column panel where failure would be in the brittle rather than ductile mode.
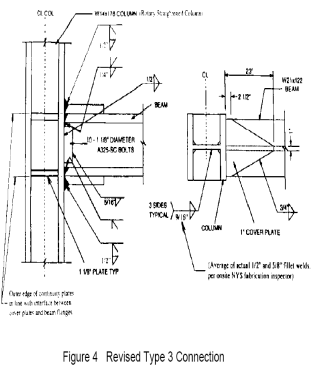
Bjorhovde R. Ref 5] made tests on such prototype joints and of these, the so-called “Type 3 Joint” performed very well. For the Type 3 connections it was decided to place the continuity plates with the outside edge in line with the beam flange to cover plate interface. Figure 4 shows the details of the Revised Type 3 connection. Bjorhovde R. Ref 5]
4.1 Cover Plate Connections
Thus, it can be seen that the introduction of cover plates, which has the effect of making the joint strong where it is coverplated, transfers the stresses to the weaker beam section beyond the joint coverplate initiating a more ductile failure mode.
4.2 Conclusions in the Study by Bjorhovde Ref 5]
“The tests of the “Type 3” connections demonstrated excellent plastic rotation and energy absorption capacities. It was also found that although cracks developed and eventually propagated through the column material, the propagation was slow and stable, with numerous crack arrests during the testing. Such was also the case for the cracks that propagated into the column k- area, demonstrating that a crack in this region will propagate in stable fashion, given appropriate connection details and fracture paths. Further, these connections used thinner cover plates and fillet welded and repositioned continuity plates. Finally, the cropping of the 413 continuity plates is important, to the effect that the ends of the welds need to be kept away from the k-area, but this observation applies to all kinds of welds and connections. In brief, fabrication and construction economies will be obtained with the Revised Type 3 connection.” Bjorhovde
4.3 Recommendation of the SAC Panel
The SAC Joint Committee Ref 7] have issued recommendations for Post Northridge Earthquake Building Construction contained in “Interim Guidelines: Evaluation, Repair, Modification and Design of Steel Moment Frames 3]
“The building code provisions for earthquake resistive design of Special Moment-Resisting Frames (SMRFs) assume that these structures are extremely ductile and therefore are capable of large plastic rotations at, or near to, their beam-column connections. Based on limited research, and observations of damage experienced in the Northridge Earthquake, it appears that conventionally designed connection assemblies configured such that plastic deformation concentrates at the beam- column connection(referring to Type 1 Joints) are not capable of reliably withstanding large plastic rotation demands. The reliability appears to decrease as the size of the connected member’s increases. Other factors affecting this reliability appear to include the quality of workmanship, joint detailing, and toughness of the base and weld metals, relative strengths of the connection elements, the combined stresses present on these elements.
Unfortunately, the quantitative relationship between these factors and connection reliability is not well defined at this time. In order to attain frames that can reliably perform in a ductile manner, these Interim Guidelines recommend that SMRF connections be configured with sufficient strength so that plastic hinges occur within the beam span and away from the face of the column. All elements of the frame, and the connection itself, should be designed with adequate strength to develop these plastic hinges. The resulting connection assemblies are somewhat complex and the factors limiting their behavior not always evident. Therefore, qualification of connection designs through prototype testing, or by reference to tests of similar connection configurations is recommended.
These procedures should also be applied to the design of Ordinary Moment-Resisting Frames (OMRFs) located in zones of higher seismicity, or for which highly reliable earthquake performance is desired, unless it can be demonstrated that the connections can resist the actual demands from a design earthquake and remain elastic. Interim Guidelines for determining if a design meets this condition are provided. Light, single-story, frame structures, the design of which is predominated by wind loads, have performed well in past earthquakes and may continue to be designed using conventional approaches, regardless of the seismic zone they are located in. Materials and workmanship are critical to frame behavior and careful specification and control of these factors is essential.
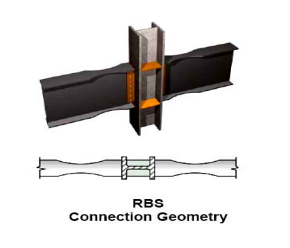
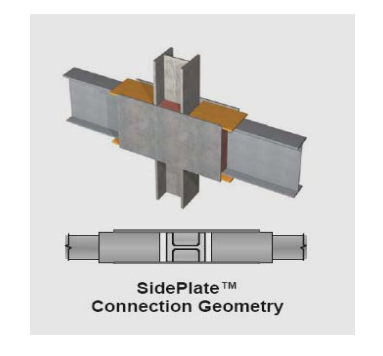
Other joint details such as the intentionally weakened beam with holes in the web, and the Reduced Beam Section (RBS), “The Dog Bone” and proprietary technologies such as the “SidePlate™ “ represent the other end of the spectrum. Houghton ref 6]
The RBS or “Reduced Beam Section” also known as the “Dog Bone” because of its shape introduces a weakening at the Beam or girder to allow it to fail in ductile mode ahead of the column.
The “SidePlate™ “ is a patented proprietary technology. The intention is to strengthen the Panel Joint with “SidePlate™ “ for the purpose of strengthening the joint and the column at the critical panel point.
Tests have shown that even with the failure of one column such as in a bomb blast, the Building will not collapse. Thus, this patented joint is now being used in construction of new US Federal Buildings.
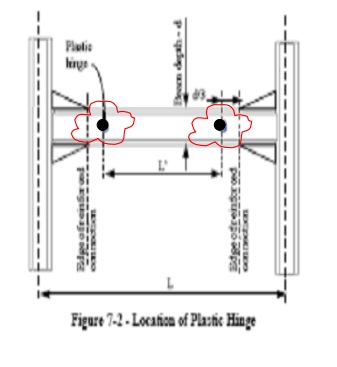
The SAC Joint Committee also evaluated several other details one of which is the induced Plastic Hinge at the web a distance from the stiffened Girder Column joint as shown below SAC Joint Committee ref 7]:
If dead loads are not very significant, then the plastic hinges can be induced at D/3 from the end of the reinforced section. However, if gravity loads are significant then a plastic design and analysis should be undertaken to determine the actual location of plastic hinging.
5.0 Closure
It is evident from the foregoing that the Traditional Type 1 Joint Detail should not be used in Structural Details anymore and that there is a need to update, supersede, amend or rescind the details given in the ASEP Guide of 1991 pertaining to this joint detail.
For Questions or Queries: emmorales02@yahoo.com
Table of references
Task committee report SAC Joint venture “Interim Guidelines: Evaluation, Repair, Modification and Design of Steel Moment Frames”
ASEP Guide “Earthquake Resistant Design of Structures” 1991 Edition
Stephen A. Mahin. “Lessons from Steel Buildings Damaged by the Northridge Earthquake”. Department of Civil and Environmental Engineering, University of California, Berkeley
National Science Foundation- Failure Analysis of Welded Steel Moment Frames Damaged in the Northridge Earthquake NISTIR 5944
Bjorhovde R. “Influence of Column Straightening Protocol on Connection Performance”. The Bjorhovde Group, Tucson, Arizona, U S A
Houghton D. et al “Post 9-11 Multi-Hazard Mitigation in Steel Frame Structures as a Function of Connection Geometry”. 71st Annual Convention of the Structural Engineers Association of California, Santa Barbara, California. September 26-28, 2002
SAC Joint Committee Interim Guidelines: Evaluation, Repair, Modification and Design of Steel Moment Frames”.
Federal Emergency Management Agency (2000). FEMA 350 “Recommended Seismic Design Criteria for New Steel Moment-Frame Buildings”.
American Institute of Steel Construction, Inc. (1997). “Seismic Provisions for Structural Steel Buildings”.
Bruneau, M. and Uang, C-M (1998). “Ductile Design of Structures”, McGraw-Hill, New York, New York.
1Master of Science in Civil Engineering major in Geotechnics and Structures, Carnegie Mellon University, Pittsburgh Pa. Chairman PICE Geotechnical Division, Former Senior Lecturer Graduate Division, School of Civil Engineering, UP Diliman.
2Master of Science in Geoengineering, major in Geotechnical Earthquake Engineering, University of California – Berkeley, CA. Member of the faculty, Mapua Institute of Technology CE Department.
3 ASEP Guide “Earthquake Resistant Design of Structures”
4 Task Committee composed of the Structural Engineers Association of California (SEAOC), the Applied Technology Council (ATC) and the California Universities for Research in Earthquake Engineering (CUREE) ). Collectively known as the SAC Joint venture. 5 Association of Structural Engineers of the Philippines
6 ASEP Guide “Earthquake Resistant Design of Structures.” 1991 Edition 7 Telephone Inquiry June 10, 2005
Emilio M. Morales MSCE EM2A Partners & Co Quezon City, MM (Philippines)
Toshio Ono MMLRT Consultants Tokyo, Japan
ABSTRACT
A support Pier (Pier 161) for a Light Rail line being constructed for the Metro Manila Light Rail Project encountered large settlements after the installation of the Precast Deck Girders. This pier supports bridge crossing across the San Juan River with a total span of sixty (60) meters. This Pier is supported on six (6) 1500 mm diameter bored piles designed to extend down to 17 meters or socketed into bedrock at least 2.0 meters based on design requirements. The structure started to settle during the erection of the superstructure when the dead load reached about 700 metric tons. Total settlement was about 42 mm when the erection was halted at a dead load of about 1600 metric tons.
The pier was designed to carry a maximum total load of about 2100 metric tons (DL + LL). Subsequent subsurface investigation conducted by our office indicated that the bored piles were terminated prematurely and were not socketed into bedrock as originally specified. The Bored pile tips were resting on approximately 150 mm of soft to very soft clay and highly weathered bedrock, which is partly natural soil and drill cuttings. Several remediation procedures were considered but finally, Jet grouting was selected .
This paper discusses the problems associated with the settlement and the ensuing solution using Jet Grouted Piles.
INTRODUCTION
The subsurface soils, being natural deposits, tend to introduce unexpected variability in the subsoil that is not revealed by the soil exploration or during construction. This situation could lead to costly delays in the process. In addition, errors in construction of foundations could lead to serious problems that would require costly intervention.
This paper addresses the foregoing real world problems, which have been solved with the use of innovative foundation technologies.
SETTLEMENT OF BORED PILE FOUNDATIONS
A pier supporting 60 m long span Precast concrete Box Girders for a light rail transit line crossing a river experienced significant settlement immediately upon placement of the Girders (Dead Load). The substructure consists of 6 X 1500 mm Diameter bored piles supporting a 1500 mm thick RC Pile cap.
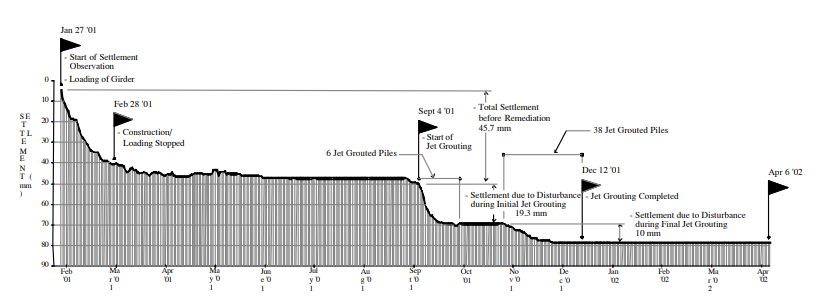
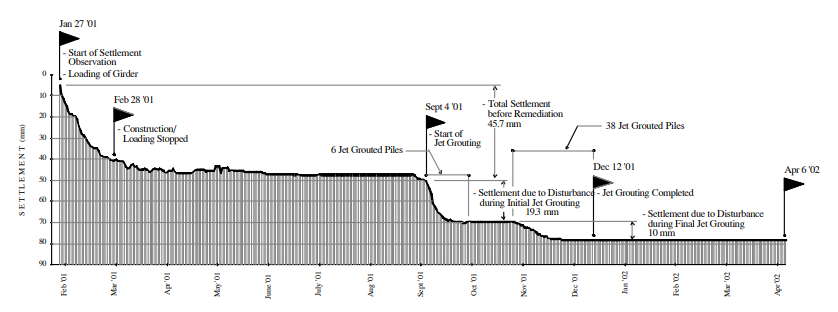
The settlements were alarming as the pier was supported on bored piling that is supposed to be socketed at least 2000 mm into bedrock. This initial settlement of 36mm caused concern and was continuing progressively until loading and other construction activities were halted. By that time, a total of 45.7mm maximum settlement had already resulted. Fig. 1 shows the settlement profile.
The erection subcontractor for the Precast Concrete Box Girder segments specified a maximum short-term settlement of 30mm and a total maximum long-term settlement of 45mm. Clearly, the recorded initial settlements have already actually violated these values and the Box Girders have to be raised by jacking in order to level the Girders.
All construction activities were halted at this juncture and intermediate heavy steel supports were placed near the Pier support in case further settlements are experienced. These supports were also used as the reaction platform for the jacking equipment.
Fig 1. Settlement History
Our organization was engaged by the Contractor initially to undertake an investigation of the subsurface to determine the possible cause/s of the settlement which was very alarming considering that this particular Pier is supported on six (6) large diameter Bored Piles on a massive pile cap.
The following are the standard design details of the Bored Pile foundation for the project:
Number of Bored Pile N = 6
Diameter of Bored Pile D = 1500 mm
Length as installed L * = Varies Theoretical Allowable Load bearing Capacity (MT) * As designed Capacity: CStatic = 515 MT/pile
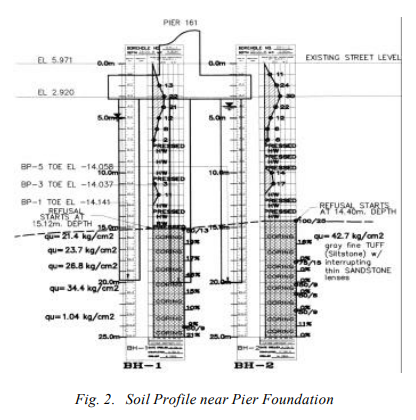
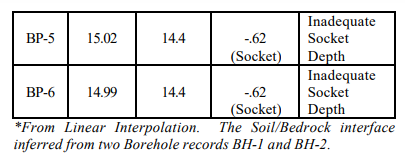
As can be seen, refusal was only encountered at a depth of 15.12 meters and 14.40 meters below existing Natural Ground Line.
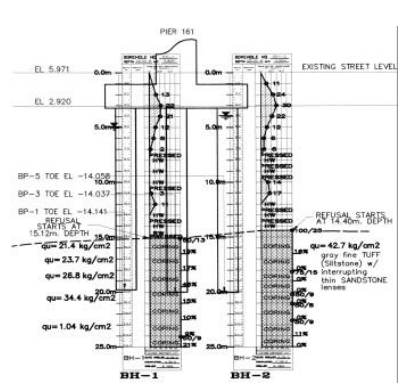
Soil Profile taken across BH-1 and BH-2 as shown in Fig. 2 indicate the slightly sloping bedrock layer.
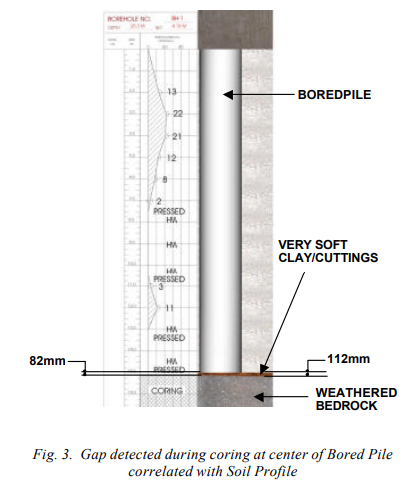
In addition to the foregoing and at a much later date, coring at the center of the Bored Piles indicated the actual gaps between the Pile Toe and the Bedrock.
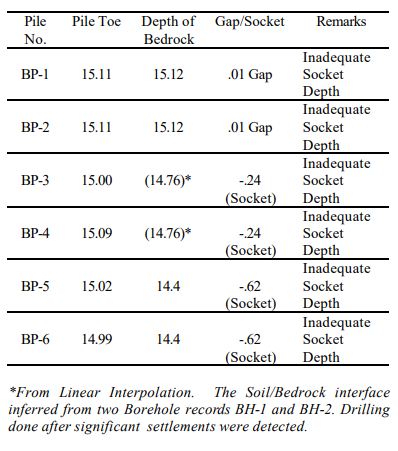
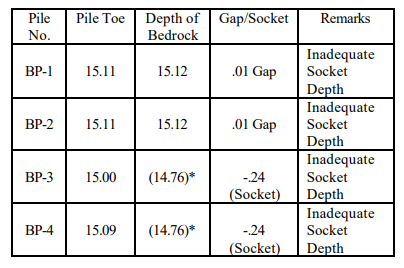
A tabulation of the initial drilling results when matched against the as assumed installed depth is shown below in Table 1.
Table 1. Tabulated Values of Bored Pile Lengths and computed gap between Pile Toe and Bedrock.
As can be seen from the above figure , two of the Bored Piles (BP-1 and BP-2), even when based on the assumed installation depth, were literally resting on very soft clay and the rest were socketed only about 0.24 meters into the possibly highly weathered Soil/Bedrock Interface.
The remaining gap is about 10mm after the recorded settlements (based on this assumed installation Depth). Thus, it was possible that the clays have been squeezed out at some locations resulting in the Bored Piles resting partly on the Bedrock and partly on very soft clay.
It was suspected that the actual gap between some of the Bored pile tips and the bedrock are as thick as 150 mm before settlements occurred as detected from later corings done at the center of the bored piles as shown in Fig. 3.
Thus, the heavily loaded Bored Piles were either resting on very soft clay or on relatively weathered Bedrock very near the Soil Bedrock interface without adequate socketing.
Geology of the Site
The site across the San Juan River in San Juan, Metro Manila is generally underlain by the Guadalupe Tuff Formation (GTF), a massive suite of soft Tuffaceous Volcanic rocks. The sedimentary rocks were formed from water laid volcanic sediments thousands of years ago. The Guadalupe tuff formation is characteristically soft Quaternary Volcanic rocks.
The Pier Foundations that settled supported the Eastern end of the 60 m long girders spanning the San Juan River atop the Lambingan Bridge.
Overburden soils are relatively poor to very poor below 7 meters and consist of clays and silts down to about 15.0 meters and sloping towards the Lambingan River. The upper layers are essentially sands, which have been precompacted by traffic and various construction activities in the vicinity.
Underlying this thin overburden sandy layer is a soft to very soft layer of clays and silts which needed to be bypassed by Bored Piles to transfer the foundation loads to more competent rock.
The RQD values below the soil bedrock interface showed relatively fair values of 19% and 16% respectively.
Average Bedrock Unconfined Compressive Strengths are about 20.0 kg/cm2 near the Bored Pile Tip characteristic of soft volcanic sedimentary rock known as the Guadalupe Tuff Formation (GTF).
What Caused the Settlement?
The Bored Piles were not adequately socketed as required and were partly resting on very weak materials. During the Bored pile installation, it was possible that boulders and large cuttings were encountered which resulted in erroneous interpretation that the Bedrock level had been penetrated. No reliable report as to what actually happened could be obtained.
As stated earlier, the specification called for a minimum socket depth of 1.0m to 2.0m into bedrock. No clear or reasonable explanation could be given as to why the Bored Piles were installed short of the target depth. It can only be assumed that this was overlooked during the installation and the hole was not cleaned or inspected at all.
Since the Bored piles were terminated prematurely, and were mainly resting on very soft clays or cuttings, settlement had to ensue. This was the primary cause of the relatively large settlement that was experienced at this particular Pier location.
Remediation Measures
Immediately upon detection of on-going settlements, formal settlement monitoring and recording was started 27 January 2001. Because of the continuing high rate of settlement, construction loading was halted on February 28, 2001. Heavy Structural Steel scaffolding was placed to support the Girders and Jacking relevelled the Girders. Still settlements continued but at a reduced rate resulting in a total of 45.7mm settlement of the Pile Cap.
The ensuing check borings (Fig. 1 and Fig. 2) verified that the Bored Pile tips were resting on very soft soils or on highly weathered bedrock.
Several remediation measures were discussed and these were Narrowed down to two feasible technologies:
The Micropiling was finally ruled out due to the large lateral forces involved, which would have required extensive use of reticulated Micropiles and extensive drilling through the heavily reinforced 1.5 meter thick pile cap. The installation alone would unavoidably cause cutting of numerous rebars in critical areas of the pile cap.
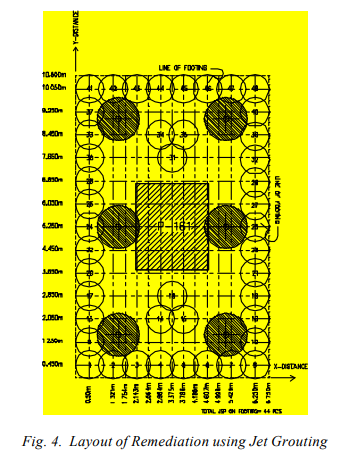
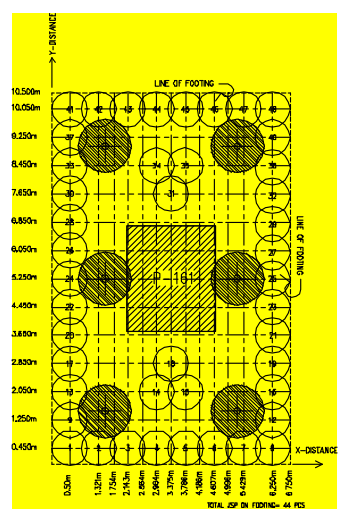
The Jet Grouting solution was finally selected because it offered a far better assurance of stability during seismic loadings and also reduced damage to the pile cap rebar. As shown in Fig. 4 the solution consisted of providing a Jet Grouted Secant Wall around the footprint of the Pile Cap and at several interior locations as shown in the plan.
This Jet Grouted Curtain Wall in Secant Pile arrangement would assure full assumption of the load from the Bored Piles while at the same time increasing resistance to sliding and overturning, because of its large footprint area and “Secant wall” arrangement.
The secant wall arrangement also had the beneficial effect of compensating for the low bending resistance of the JGP by behaving as a wall providing lateral support for adjacent elements. The Final installation resulted in the use of 44 pieces of JGP elements including two clusters of 3 JGP in the interior. These were intended to fully take up the load on the bored piles during service loading effectively relieving the bored piling of any load.
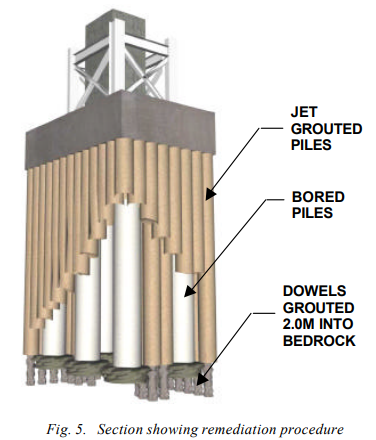
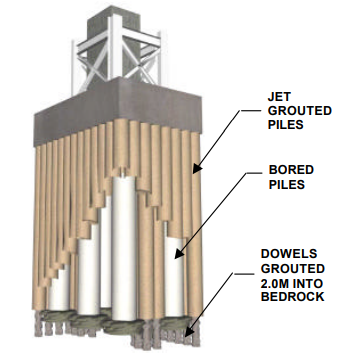
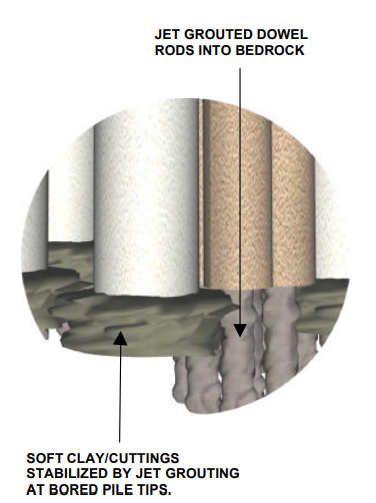
A cutaway section of the remediation is shown below as Fig. 5.
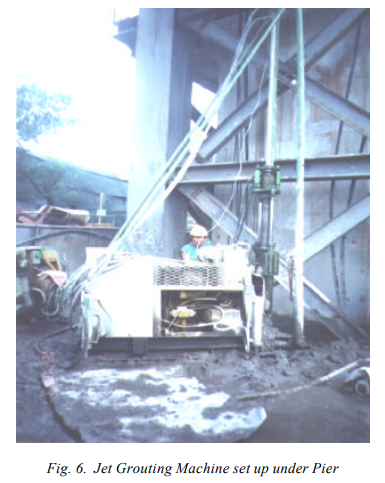
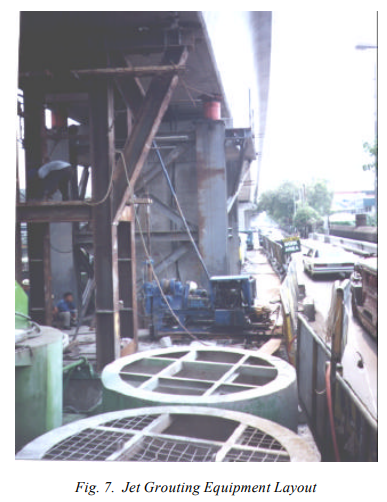
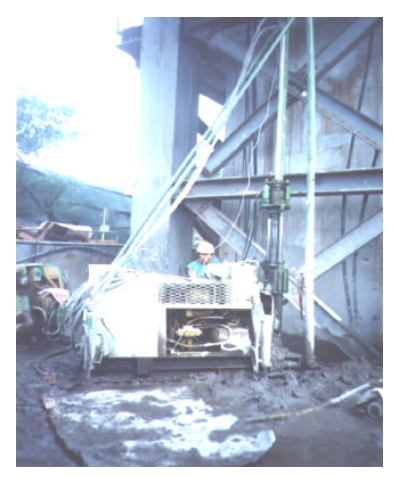
A set up of the equipment underneath the Girders is shown in Fig. 6 and 7. The equipment is a Double tube Jet Grouting System with Grout injected through a side jet protected by a compressed air shroud.
In addition, each of the Jet Grouted Piles were reinforced at the center by 25mm Ø rebars which were inserted by redrilling the Jet Grouted Piles (JGP) after it has sufficiently cured, and extending this 2.0 meters beyond the Soil/Bedrock interface into competent Bedrock. The drilled holes and dowel bars were subsequently regrouted effectively doweling each JGP into the Bedrock.
Expansive admixture and higher strength mix was used to grout the rebar to the Pile Cap. This provided extra shear capacity over and above that provided at the Pile Cap/JGP Interface and also at the JGP/bedrock interface further increasing sliding resistance.
The settlement record for the project is shown in Fig. 3. The milestones are flagged. It can be seen that with the initial Jet Grouting, additional settlement of 19.3mm was experienced due to further disturbance of the weak soils near Bored Pile Tips, although care was exercised to reduce such disturbances to the minimum by initially drilling far from the Bored piles. The Girders had to be releveled again by Jacking.
The Jetting was halted to allow for the curing of the Soilcrete and also because questions were raised about the effectiveness of the technology given the additional settlements. After Field trials were done to verify the effective diameter of the JGP and the Guaranteed Compressive Strength it was shown that the Test Piles satisfied or even exceeded project requirements. Subsequently, Jet Grouting was restarted for the final Jet Grouting of 38 Piles on November 1, 2001. Only 10mm additional settlements were recorded. The Jet Grouting was completed on December 12, 2001. By this time settlements have tapered off and allowed work to be restarted on the superstructure including the laying of ballast stone.
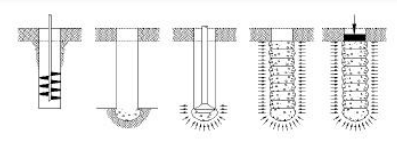
In addition, the Project consultants required that the existing Bored piles be redrilled at the center to allow for the insertion of Grouting Pipe in order to grout the pile tip. Jetting was done to wash away the remaining soft clay on the now hanging bored piles and jet grouting with rich grout was done. This would ensure that once the “Soilcrete” had cured, the Bored pile tips would be resting on solidified ground. This was accomplished after the initial JGP installation and was done initially in areas where the JGP have substantially cured and attained full strength.
This added measure partially restored the load carrying capacity of the bored piles allowing it to contribute to the overall load capacity rather than just hang as “deadweight” from the pile cap.
The solidification at the tip of the Bored pile is shown in the figure below:
No further settlements have been recorded despite the placement of ballast and rail tracks as well as other hardware and the remediation was considered successful.
Lessons Learned
Careful monitoring of the Bored Pile installation is very important to ensure the integrity of the Bored Pile foundation including adequate and proper cleaning of the bottom from cuttings and degraded rock. It is also important to ensure that the specified socket depth is attained and adequately verified by actual inspection.
The jet grouting remediation turned out to be effective in arresting the settlements with minimal disturbance to traffic and the surrounding houses and commercial establishments. It also ensured the lateral stability of the substructure due to earthquake loading which was a primary concern .
The innovative remediation process instituted successfully arrested the settlements and restored the Pier to full serviceability.
Emilio M. Morales, MSCE – Master of Science in Civil Engineering major in Geotechnics and Structures, Carnegie Mellon University, Pittsburgh Pa. Chairman PICE Geotechnical Division, Former Senior Lecturer Graduate School, Dept of Civil Engineering, UP Diliman.
Mark K. Morales, M.Sc – Master of Engineering Major in Geoengineering, University of California – Berkeley, CA. Former Member of the faculty, Mapua Institute of Technology CE Department., Member of the Faculty, Graduate School, Dept. of Civil Engineering, UP Diliman.
1 INTRODUCTION
Most often, the quantification of shrinkage strains and magnitude are not necessary requirements, as provision of adequate number and spacing of shrinkage and construction joints normally would ensure a trouble free concrete slab construction.
It is only when troubles arise like serious cracking and curling is there a need to look into actual magnitudes particularly if liability or litigation threats are in the offing. The actual magnitude of shrinkage strains are quantifiable based on well established procedures published by the American Concrete Institute (ACI 209R-92).1] Particularly, this calculations would be needed in order to determine whether a member would crack or not due to shrinkage or if the problem of cracking is due to some other causes. In such cases, it is necessary that the actual magnitude of shrinkage strains be determined to ensure that these strains do not exceed the permissible limits.
1.1 Prediction of Actual Shrinkage Values based on ACI 209R-92
Concrete shrinks due to moisture loss. However, the actual magnitude of ultimate shrinkage is dependent on a lot of factors as contained in ACI 209R-92.
These factors are:
Relative Humidity
Minimum Thickness
Water Cement Ratio W/C
Slump
Air Content
Fines Content
In order to predict the actual shrinkage, it is necessary to perform actual calculations taking into account the foregoing factors.
Totally neglecting these procedures renders any conclusion invalid and at best highly speculative.
The use of a real construction problem would best illustrate the need for and importance of Calculation procedures based on universally accepted “State of Practice”.
This was what happened in a real world project of ours, 2] where major Shrinkage cracking has occurred; blame is being placed squarely on the Engineer of Record with various claims that are unsubstantiated. One of these is a claim by the contractor’s hired foreign consultant that shrinkage stresses even with the high W/C ratio is not the cause of cracking. The consultant even provided oversimplified calculations just to justify that cracks were not due to shrinkage since by not being able to do so, the very high and non compliant W/C ratio as placed will surely point to the main reason for the cracking.
In order to disprove the self serving and highly erroneous calculations presented, we proceeded with the appropriate Calculation based on a rational procedure as recommended in ACI Committee 29 1].
This is the main topic of this article and by outlining the procedures taken, the reader/s will be guided in how actual shrinkage is calculated which even if complicated is required particularly when the problem blows into a litigation headache.
1.1.1 Calculation of the Ultimate Shrinkage Value
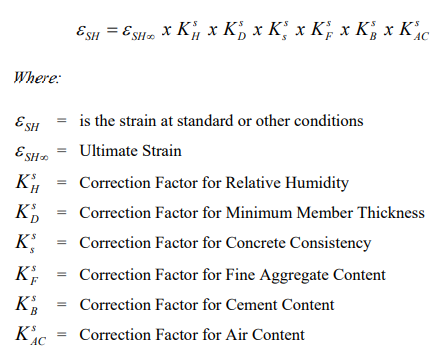
The ultimate shrinkage value SH can be predicted for conditions other than standard 3] using:
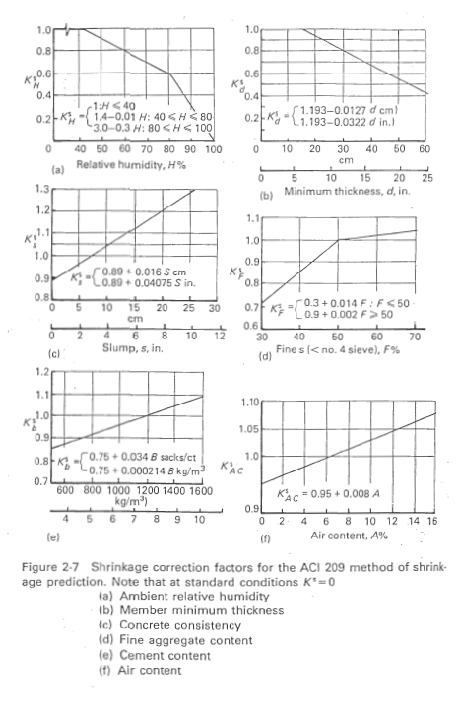
The attached charts in Appendix “B” give the corresponding values used on our calculations for the various conditions based on ACI 209R-92.
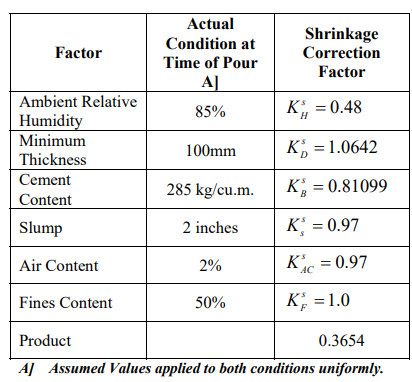
Based on the foregoing equation and quantification of actual conditions for the specific project (see Appendix “A” for a complete detail of the above.)
The foregoing values need to be applied on the Ultimate Shrinkage Value SH to yield the shrinkage strains at actual conditions.
It is not correct to use assumed “Standard Values” as was done by the contractor’s Foreign Consultant for the concrete in question because the conditions were not standard for this project.
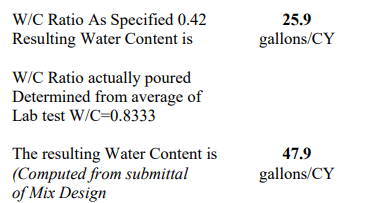
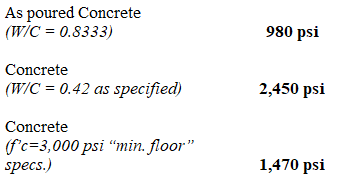
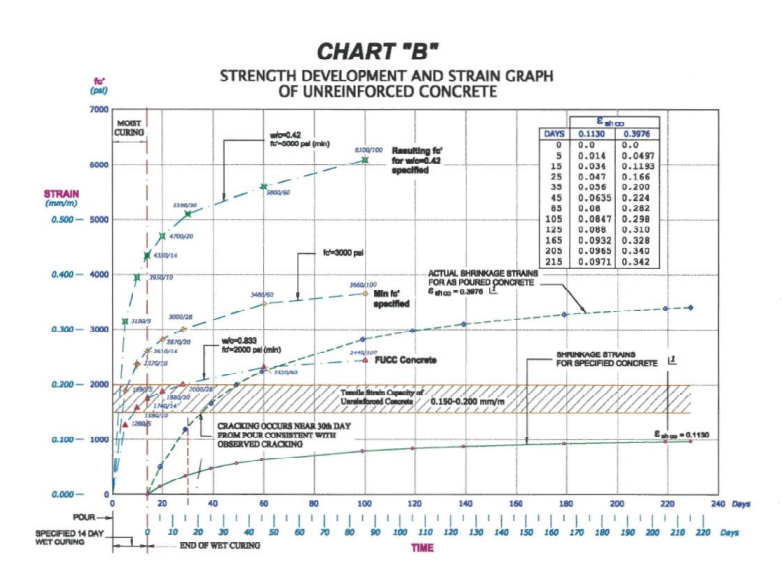
In addition, the concrete as poured by the contractor excessively violates the specified maximum Water Cement Ratio W/C (Specified 0.42 vs. Actual 0.8333) by 98.4% based on tests of Water Content and Water Cement Ratio W/C conducted by a New Zealand Laboratory and as cited in the contractor’s Consultant Final Report.
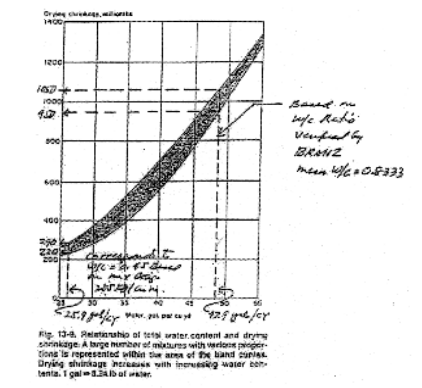
However, the effect on the resulting strains is non linear and is greater at higher water contents. The Portland Cement Association4] has a widely accepted and well documented procedure for prediction of what shrinkage strains could be under various Water Cement Ratios and under other equally important considerations for the ambient project conditions existing during the pour. (thus, it is important for the consultant and the PM to record these conditions at every pour). The chart below is taken from Reference 2.0 and shows how the shrinkage contribution from various Water Cement Ratios could be quantified:
Based on these charts, and with the following actual data:
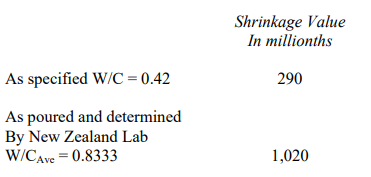
From these values, the Upper Band of the curve is entered to yield the following shrinkage magnitudes:
There is significantly, a lesser shrinkage value based on the specified W/C of 0.42 over “normal” concrete and a very large increase in the case of excessive W/C as provided (W/C=0.833 provided vs. W/C=0.42 specified).
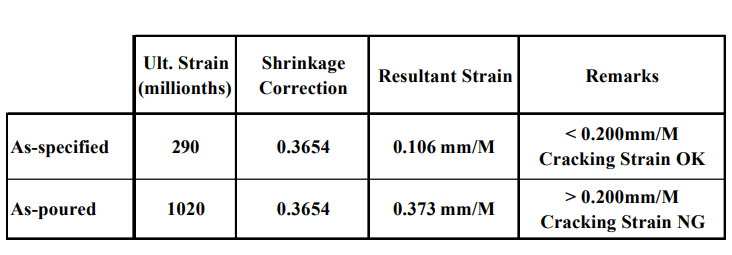
The values obtained, 290 microstrain or 0.29mm/meter and 1.020 microstrain or 1.02 mm/meter are used as base or reference figure in predicting quantitatively the actual shrinkage magnitudes in this specific case using ACI 209 procedures. The effects of various other factors can be introduced further.
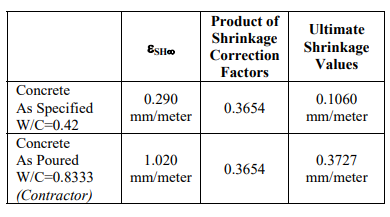
It can be seen from the above that the actual Ultimate Shrinkage Strains (SH) produced by the as poured concrete (W/C=0.8333) is 251.7% greater than for the specified concrete (0.290 vs. 1.020 mm/meter).
If the shrinkage correction factors as prescribed by ACI 209 are applied, the resulting Actual Shrinkages would be:
1.2 Prediction of Shrinkage at any Time Based on ACI 209R-92
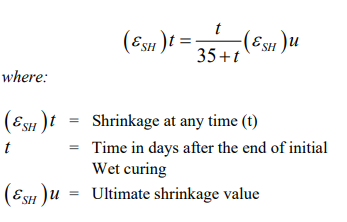
Shrinkage prediction at any time after age 7 days for moist cured concrete is given by equation 2-9 ACI 209R-92 as follows:
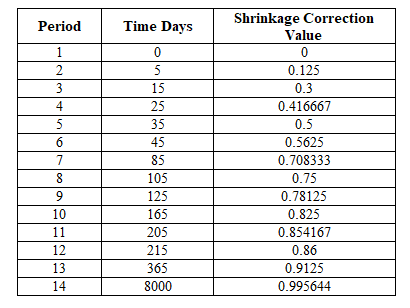
This equation is a very powerful tool in quantifying the actual magnitude of shrinkage at any time but more importantly during the moist critical stage of strength development when the concrete has not yet fully attained its design strength.
Using the above Equation 2-9 with a curing period of 14 days as specified, the following shrinkage strain factors are generated for various times beyond the 14 day initial wet curing period.
What the foregoing data portray is that the shrinkage value attained at approximately one year (365 days) is 0.91 of the ultimate shrinkage value. More importantly it shows that shrinkage strain development is gradual and does not reach peak value until a considerable period of time has elapsed.
This is very crucial in determining and quantifying what actually happened to the slab when these were reported to have cracked after approximately one month after pouring.
2.0 SIGNIFICANCE OF CALCULATION RESULTS
Based on calculations consistent with ACI 209R, the following conclusions can be made:
The as specified concrete with W/C=0.42 will not exceed the Allowable Tensile Strain Capacity of unreinforced concrete at any time. (SH=0.1060mm/meter vs. SHAllowable =0.150 to 0.200mm/meter).
The as poured concrete exceeded the Allowable Tensile Strain Capacity even initially at approximately 30 days after wet curing (almost exactly at the same time the first cracks were observed). (SH=0.3727mm/meter vs. SHAllowable =0.150 to 0.200mm/meter).
The results underscore the effectiveness of the shrinkage control measures that have been specified by this Engineer of Record to limit the strains to tolerable values have the correct W/C been followed.
It is not correct to use any other data such as “Approximately 0.35mm/meter” as the actual strain since this is not representative of the actual conditions and remain merely as baseless assumptions.
In truth, the actual magnitude is very much less than this prediction, due to the effect of very low W/C specified and other measures used to control shrinkage.
The results of the calculations for predicting the actual magnitude of the Ultimate Shrinkage SH based on ACI 209R- 92 (Section 3.0) and the prediction of the rate of development of shrinkage with time (Section 2.0) also from ACI 209R-92 where graphically presented in order to present a clearer picture of what actually happened and what was the real cause of shrinkage.
Note: This is consistent with the Field observations that the cracking occurred approximately one month after pouring.
2.1 Plastic Shrinkage Stage
At the critical stage when plastic shrinkage was happening (1-3 days) the corresponding strengths are as follows:
Thus, it can be seen that strength development at the critical Plastic Shrinkage Development would have been adequate for the specified W/C Ratio and is more than 2.5 times that of the as poured concrete.
Thus, the as poured concrete had very low available strength because of the very high W/C Ratio and is inadequate to resist plastic shrinkage cracking.
2.2 Curing Stage
For the specified 14 day curing period, drying shrinkage is not yet developing, for this reason the time scale for strain development is offset by 14 days.
What this mean in simple language is that the drying shrinkage is postponed until after the wet curing period of 14 days. During this time, and because the area is fully enclosed, humidity built up, because of the wet curing procedure and due to the absence of air movements.
2.3 Drying Shrinkage Period
Beyond the 14 day Wet Curing specified, shrinkage strains from drying started to set in and the development is predicted by Equation 2-9 of ACI 209R.
Despite the high relative humidity inside the pouring area, it was not enough to arrest cracking of the as poured slab due to the very high shrinkage potential from the excessive water content of the as poured slab, something clearly illustrated by CHART ‘A’ which is a graphical presentation of the calculation results.
3.0 Closure
The foregoing calculations for an actual problem have shown that shrinkage stresses can be calculated and that the shrinkage is excessive and beyond that have occurred tolerable limits due to the high water cement ratio W/C of the as laid concrete in violation of the specs.
The rational formulas as prescribed by ACI Committee 209 is an invaluable tool in determining the magnitude of shrinkage strains in the concrete which are indisputable if the actual conditions are used.
1] ACI Committee 209. “Prediction of Creep, Shrinkage and Temperature Effects in Concrete Structures”. ACI 209F-92 contained in ACI Manual of Concrete Practice, 1996, Part 1. 2] For Obvious Reasons the Project and personages involved cannot be named.
3] The standard conditions are based on US conditions.
4] Steven H. Kosmatka and William C. Panarese. “Design and Control of Concrete Mixtures”. Thirteenth Edition. Portland Cement Association, Old Orchard Road, Skokie, Illinois.
Author: EMILIO M. MORALES, MSCE (Principal) Organization: EM2A Partners & Co. Address: QUEZON CITY, PHILIPPINES
ABSTRACT
Foundation problems abound and sometimes solutions to various foundation problems could result in costly procedures or measures in order to remedy the problem. Introduction of Innovative Solutions to problems in Foundations together with a clear understanding of the problem and application of Innovative Technologies result in cost effective solutions. Two case studies are presented in this paper to illustrate such solutions.
The subsurface soils being natural deposits tend to introduce unexpected variability in the subsoil that is not revealed by the soil exploration or during construction. This situation could lead to costly delays in the process. In addition, errors in construction of foundations could lead to serious problems that would require costly intervention.
This paper addresses the foregoing real world problems, which have been solved with the use of innovative foundation technologies.
Two (2) case studies are discussed to illustrate the measures and solutions employed to solve the problem.
CASE I – SETTLEMENT OF BORED PILE FOUNDATIONS
A pier supporting 60 m long span Precast concrete Box Girders for a light rail transit line crossing a river experienced significant settlement immediately upon placement of the Girders (Dead Load).
This initial settlement of 36mm caused concern and was continuing progressively until loading and other construction activities were halted. At that time, a total of 45.7mm maximum settlement has already resulted.
The erection subcontractor for the Precast Concrete Box Girder segments specified a short-term maximum settlement of 30mm and a total long-term maximum settlement of 45mm.
The initial settlements have actually exceeded these values and the Box Girders have to be relevelled by jacking in order to level the Girders. All construction activities were halted at this juncture and intermediate heavy steel supports were placed near the Pier support in case further settlements are experienced.
Our organization was engaged by the Contractor initially to undertake an investigation of the subsurface to determine the possible cause/s of the settlement which was very alarming considering that this particular Pier is supported by six (6) large diameter Bored Piles on a massive pile cap.
The following are the details of the Bored Pile foundation:
Number of Bored Pile N = 6
Diameter of Bored Pile D = 1500 mm
Length as installed L ] = Varies
Theoretical Allowable
Load bearing Capacity (MT) ]
CStatic = 515.46 MT/pile CEqk = 799.69MT/pile
The design called for embedment into soft Bedrock of 1.0 to 2.0 meters depending on whether the Bored Pile embedded length is long or short (> or < 10.0 meters). Two check Boreholes were drilled, one at the toe of the Pile cap and another near the edge of the column close to the middle Bored Pile.
The check Borings (Fig. 1.0 below) indicated that the overburden soils are relatively poor to very poor beyond 7 meters as shown in the Soil Profile below for BH-1 and BH-2.
Fig. 1 – Soil Profile near Pier Foundation
As can be seen, refusal was only encountered at a depth of 15.12 meters and 14.40 meters below existing Natural Ground Line.
A tabulation of the drilling results when matched against the installed depth is shown below:
Fig. 2 – Tabulated Values of Bored Pile Lengths
As can be seen from the above, two of the Bored Piles (BP-1 and BP-2) were literally resting on very soft clay and the rest were socketed only about 0.24 meters into the possibly highly weathered Soil/Bedrock Interface.
The RQD values below the soil bedrock interface showed relatively fair values of 19% and 16% respectively.
Bedrock Unconfined Compressive Strengths are about 20.0 kg/cm2 near the Bored Pile Tip characteristic of soft rock known as the Guadalupe Tuff Formation (GTF).
Thus, the heavily loaded Bored Piles were either resting on very soft clay or on relatively weathered Bedrock very near the Soil Bedrock interface without adequate socketing.
The remaining gap is about 10mm after the recorded settlements. Thus, it was possible that the clays have been squeezed out at some locations resulting in the Bored Piles resting partly on the Bedrock and partly on very soft clay.
This is the primary cause of the relatively large settlement that was experienced at this particular Pier location.
Geology of the Site
The site across the San Juan River in San Juan, Metro Manila is generally underlain by the Guadalupe Tuff Formation (GTF), a massive suite of soft Tuffaceous Volcanic rocks. The Pier Foundations that settled supported the Eastern end of the 60 m long girders spanning the river.
Overburden soils are relatively poor to very poor below 7 meters and consist of clays and silts down to about 15.0 meters and sloping towards the San Juan River. The thick and very poor overburden needed to be bypassed by Bored Piles to transfer the foundation loads to more competent rock.
What Caused the Settlement?
The Bored Piles were not adequately socketed as required and were partly resting on very week materials. It was possible that boulders and large cuttings were encountered which resulted in erroneous interpretation that the Bedrock level had been penetrated.
As stated earlier, the specification called for a minimum socket depth of 1.0m to 2.0m into bedrock. No clear or reasonable explanation could be given as to why the Bored Piles were installed short of the target depth. It can only be assumed that this was overlooked during the installation and the hole was not cleaned or inspected at all.
The Jet Grouting solution was finally selected because it offered a far better assurance of stability during seismic loadings. As shown in Fig. 3 the solution consisted of providing a Jet Grouted Wall around the footprint of the Pile Cap and at several interior locations as shown in the plan.
This Jet Grouted Curtain Wall in Secant Pile arrangement would assure full assumption of the load from the Bored Piles while at the same time increasing resistance to sliding and overturning.
Fig. 3 – Settlement History
Remediation Measures
Immediately upon detection of on-going settlements, formal settlement monitoring and recording was started 27 January 2001. Because of continuing high rate of settlement, construction loading was halted on February 28, 2001. Heavy Structural Steel scaffolding was placed to support the Girders and Jacking releveled the Girders. Still settlements continued but at a reduced rate resulting in a total of 45.7mm settlement of the Pile Cap.
The ensuing check borings (Fig 1.0) verified that the Bored Pile tips were resting on very soft soils or on highly weathered bedrock.
Several remediation measures were discussed and these were narrowed down to two feasible technologies:
Fig. 4 – Section showing remediation procedureFig. 5 – Jet Grouting Machine set up under PierFig. 6 – Jet Grouting Equipment LayoutFig. 7 – Layout of Remediation using Jet Grouting
In addition, each of the Jet Grouted Piles were reinforced at the center by 25mm Ø rebars which were inserted by redrilling the Jet Grouted Piles (JGP) and extending 2.0 meters beyond the Soil/Bedrock interface into competent Bedrock. The drilled hole and dowel bar were subsequently regrouted effectively doweling each JGP into the Bedrock. Expansive admixture and higher strength mix was used to grout the rebar to the Pile Cap. This provided extra shear capacity over and above that provided at the Pile Cap/JGP Interface.
The settlement record for the project is shown in Fig. 3. The milestones are flagged. It can be seen that with the initial Jet Grouting, additional settlement of 19.3mm was experienced due to further disturbance of the weak soils near Bored Pile Tips, although care was exercised to reduce such disturbances to the minimum by initially drilling far from the Bored piles. The Girders had to be releveled again by Jacking.
The Jetting was halted to allow for the curing of the Soilcrete and also because questions were raised about the effectiveness of the technology given the additional settlements. After Field trials were done to verify the effective diameter of the JGP and the Guaranteed Compressive Strength it was shown that the Test Piles satisfied or even exceeded project requirements. Subsequently, Jet Grouting was restarted for the final Jet Grouting of 38 Piles on November 1, 2001. Only 10mm additional settlements were recorded. The Jet Grouting was completed on December 12, 2001.
Although the Jet Grouted Curtain wall would be more than adequate to support the total foundation loading, the Project consultants required that the existing Bored piles be redrilled at the center to allow for the insertion of Grouting equipment in order to grout the pile tip. This would ensure that once the “Soilcrete” has cured, the Bored pile tips would be resting on solidified ground. This was accomplished after the initial JGP installation and was done initially in areas where the JGP have substantially cured and attained full strength.
The solidification at the tip of the Bored pile is shown in the figure below:
Fig. 8 – Bored Pile Tip Detail After Grouting
No further settlements have been recorded despite the placement of ballast and rail tracks as well as other hardware and the remediation was considered successful.
Lessons Learned
Careful monitoring of the Bored Pile installation is very important to ensure the integrity of the Bored Pile foundation including adequate and proper cleaning of the bottom from cuttings and degraded rock. It is also important to ensure that the specified socket depth is attained.
The innovative remediation process instituted successfully arrested the settlements and restored the Pier to full serviceability.
CASE 2 – WAREHOUSE CLUB ON VERY POOR SOILS
A 6,500 square meter retail warehouse was to be constructed on very poor swampland soils originally used as a precast concrete plant yard.
The original solution called for Driving of R.C. Precast Piles to support the warehouse including the Warehouse floor, as anticipated settlements would result in cracking of the heavily loaded floor. The suspended structural floor supports merchandise racking with a distributed load of about 450 psf. The levelness of the floors is critical for the safe operation of the medium reach forklifts used in the warehousing operations.
However, during the initial Test Pile driving, complaints were received from the neighborhood residents due to large vibrations experienced as well as damage due to cracking of walls in several houses.
The damage was due to soft ground amplification of the pile driving vibrations. Work had to be halted indefinitely until a substitute could be proposed. The only alternative was to use Bored Piles. In order to optimize and mobilize the full capacity of the Bored Piles, the Bored Piles would have to be deep and the loads concentrated onto a limited number of Bored Piles. This, in turn, required heavy structural framing systems consisting of Deep Girders and Beams to carry the heavily loaded Warehouse floor and transfer the loads to the Bored Piles. The resulting cost of the Bored Pile foundation and heavy floor framing system was estimated at P45.0 Million.
Value Engineering Alternative
Our company offered a value engineering alternative using Geopier® foundation. The proposed solution consisted of installation of about 1900 Geopier of 3.0 to 3.5 meter length supported on the very soft soils. The Geopier foundation system is a Rammed Aggregate Pier system using patented technology. Installation is done in the following sequence shown by the fig below:
Fig. 9 – Sketch of Geopier® installation procedure
Due to the installation procedure, which consisted of ramming the aggregates using a patented beveled rammer, lateral prestraining and precompaction of the surrounding soils were realized. This prestraining and prestressing effect resulted in significant increases in lateral stresses around the Geopier perimeter resulting in very significant stress transfer by skin friction to the surrounding soils. Only very minimal residual stresses due to the loading were transferred to the Geopier tip thus resulting in large reduction in settlements of the Geopier.
The columns were supported on two or three 3.5 meter Geopier. Columns supporting Canopies requiring uplift resistance were supported on tension Geopier, which were reinforced with, rebars restrained near the Geopier tip by steel plates.
The suspended structural framing Support of the merchandise and warehouse floor was totally eliminated. In its place, a very innovative slab support system was substituted. The slab support system consists of a 1.0 meter thick Engineered Granular fill supported on Geopier at 3.0 meter on centers by arch action. The arch action transfers the entire load onto the Geopier elements. This enabled the floor slab to be designed as a conventional slab on Grade with reduced reinforcement and with very minimal settlements.
Fig. 10 – Sketch showing slab support using Engineered fill to transfer floor loads to Geopier by Soil arching.
This value engineering alternative was considered only after written guarantees secured by a USD 500,000 liability insurance was issued by our US Principals to limit the settlements to within 20mm.
However, this innovative solution presented several advantages to the owner as follows:
Reduction in foundation installation time
Reduction in overall construction time by elimination of a structural floor system.
Significant cost reduction due to the high cost of Bored Piling as well as the integral structural floor framing system.
Furthermore, it was stipulated that we have to perform an actual Field Installation demonstration with the Village Association Officers in attendance in order to convince them regarding the minimal vibration and noise resulting from the installation and also to ensure that no damage will result from such activities.
This was successfully done and the contract was awarded to the company.
Modulus Load Test
As part of the execution, a Modulus load test was performed on a production Geopier in order to determine the settlement under the full service load. The Geopier Modulus test is similar to the setup used in a pile load test but the interpretation is different.
Fig. 11 – Modulus Load Test Graph
The Stiffness modulus values of installed Geopier elements are determined by full-scale modulus tests. The test is performed by applying pressure in gradual increments over the full cross-section area at the top of a Geopier element. The stiffness modulus value corresponding to 100% of the design stress applied to the top of the pier is determined based upon the load test results, and is typically expressed in English units as pci, and in metric units as MN/m3. The Geopier modulus load test is not a bearing capacity type test, such as a pile load test. Rather, it is a settlement test to determine a conservative value of pier stiffness. The Geopier foundation system design uses the stiffness modulus value measured at the point of maximum anticipated design stress; i.e., at 100% design top of Geopier stress (or at the maximum acceptable deflection) from the modulus load test results. Geopier modulus tests are normally performed to a top of Geopier stress equal to 1.5 times the maximum design stress. The purpose of applying load to more than the design stress is just to observe the Geopier element deformation characteristics at higher stress levels.
The results of the Modulus load test for this specific project is shown in Fig. 12 below:
Fig. 12 – Modulus Load Test Results
As can be seen from the above a total of only 0.218mm settlement was obtained under full service load and that failure was not reached at 1.5 times the maximum service load. A residual settlement of only 0.231mm was left after unloading of the Modulus test.
The installation was done at the height of the Typhoon season but the project was completed on time.
As a result of this Value Engineering alternative, the construction time was shortened by two (2) months allowing for an earlier opening of the Warehouse club. This was because the heavy suspended floor was totally eliminated and the floor was designed as slabs resting on a compacted engineered fill instead. The engineered fill in turn is supported on Geopier spaced at 3.0 m on centers by arch action.
The construction sequence also was favorable to the General contractor as the GEOPIER procedure allowed immediate work to be undertaken immediately after a section has been completed. Critical time waiting for the curing of piling etc was totally eliminated. Compaction of the engineered fill was started at sections adjacent to Geopier installation activity without the possibility of disturbance to the engineered fill. Pouring of the concrete slab on grade immediately followed the completion of the engineered fill compaction. At any given time, concrete pouring was about two bays distant from any Geopier installation activity, thus vibrations are no longer a critical issue during the curing of the concrete.
This also resulted in a savings of about P 20 million over that of the cost of bored piling and suspended structural floor system.
The project was completed two months ahead of the original scheduled date of opening and the overall savings due to this value engineering solution was very significant.
Lessons Learned
Pile driving on very soft soils can cause amplification of harmful vibrations, which could damage adjacent structures. In addition, breakages of driven concrete piles during driving are possible due to the setup of tension waves from rapid pile driving. Costly suspended floor systems can be eliminated with the use of innovative solutions for load support.
Conclusions
The foregoing are but two of many available solutions to solve day-to-day Foundation problems innovatively. The two cases also illustrate what can go wrong in a project, which may require the use of new or innovative technologies to solve the problem effectively.
] Based on Piling Contractor’s Bored Piling record. ] From Capacity Calculation Sheets.
ABSTRACT: A large area wear slab was designed as a jointless wear slab. Originally specified with shrinkage compensating concrete (SCC). The slab was poured as an ordinary PCC concrete with temperature rebars due to non availability of SCC. The wear slab is underlain with two layers of 300 mm thick Expanded Polystyrene EPS which turned out to be substandard. Subsequently, approximately two months after pouring, severe cracking and dusting occurred. The cracks were predominantly spiderweblike cracks and also manifestations of shrinkage induced parallel cracking. An investigation was requested by the Owner from the Engineer and two Third Party Engineers. This was followed by a report from the EPS supplier commissioned Engineer. The latter laid the blame almost entirely on the Prime Contractor and the Engineer. The ensuring debate resulted in a three cornered fight between the Owner/Engineer, the Prime Contractor and the EPS Supplier. This paper presents the Engineer’s own investigation and the final outcome of the problem. The paper is good reading for Engineers and Contractors alike who face or are likely to face litigation due to construction problems.
INTRODUCTION
A large area Dairy Products Warehouse approximately 1.4 hectares covered area required that the wear slab on the Refrigerated Warehouse areas be of jointless construction for reasons of sanitation and hygiene. The slab was specified to have a maximum water cement ratio of 0.42. This would result in a minimum concrete compressive strength fc’ of 35 MPa (5,000 psi).
The wear slab is underlain by two layers of Expanded Polystyrene (EPS) supported in turn by a structural slab on grade. The slab on grade rests on well compacted gravel base course on compacted subgrade.
Figure 1.0
The wear slab was originally proposed to be poured using Shrinkage Compensating Concrete (SCC). However, due to non-availability, this was not possible. The Engineer then specified the use of Fly Ash in order to reduce the heat of hydration and also the water demand. However, the contractor certified to the non availability of Fly Ash at that time. As a result, the Owner ordered the pouring of the slab without SCC or Fly Ash.
The slab was required to be poured only after the roofing and cladding have been installed to protect against the weather. Two months after pouring, the slab exhibited cracks that were predominantly spiderweb-like but also manifested parallel cracks characteristic of shrinkage cracking.
In addition, and after the warehouse was made operational, severe dusting in some areas posed a critical problem. The dust was being recirculated by the ducted airconditioning system causing discomfort to personnel and also as a potential source of contamination to the dairy products. As a result the Owner, in consultation with the Engineer of Record provided an overlay slab. The overlay slab sealed the old wear slab and supplanted the cracked wear slab which provided the permanent solution.
However, the Owner wanted to pin responsibility and even before the plant was placed in service, investigations have been conducted. The results of these investigations, the final conclusions and how the problem was identified and resolved are the topics of this paper.
NATURE OF CRACKS
The cracks were detected in various areas of the refrigerated stores and manifested themselves as spider web like in appearance within depressed areas. Also, parallel transverse cracks about 0.5m to 3.0m in length were detected in various areas.
The cracks only occurred in the refrigerated areas which is underlain by EPS.
INVESTIGATIONS MADE
Investigation by Engineer of Record
The Owner initially requested the Engineer to conduct an initial investigation to determine the cause/s of the cracking in the refrigerated area and to make necessary recommendations on the remedial measures needed to restore the slab to its functional serviceability. Due to the preponderance of dishing patterns marked by spiderweblike cracks, the Engineer of Record focused on subgrade failure or settlement as the cause. However, structural calculations were also made to check that the slab would be adequate for the forklift loads imposed. This was verified to be adequate based on Westergaard analysis treating the EPS as the subgrade.
Subsequently, destructive investigations were ordered by the Engineer which consisted of:
Concrete coring on the wear slab for Unconfined Compression Tests.
Large diameter coring of the EPS to determine the density (and the modulus by correlation with density) and load at 10% deformation.
The results showed that:
The concrete was grossly understrength.
The EPS is substandard and very much below the specified density of 32 kg/cu.m.1] and the modulus was also low.
Figure 2.0
The EPS supplier made similar and parallel tests which essentially corroborated the Engineer’s test results and clearly established that the concrete and EPS were both substandard. Although the foregoing results initially addressed the issue, the shrinkage cracks can not be explained by these findings and additional studies were needed.
Independent Local Consultant
The Owner then also hired an independent local Consultant who concurred right with the Engineer of Record’s findings in a meeting attended by all parties.
Independent American Consultant
Not content with the foregoing, the Owners foreign Joint Venture partners hired a second independent Consultant who, after visiting the plant and seeing the cracks immediately concurred that it was subgrade failure due to the compressibility of the substandard EPS.
He stated in his report and we quote: “Based on information presented to this office to date, it is our opinion that the cracking problem was caused by failure of the Polystyrene Foam insulation to meet project specifications”.
The Owner was ready the slap claims for damages on the EPS Supplier.
EPS Suppliers Consultant
As a defensive measure, the EPS supplier recommended a Third Independent Consultant from New Zealand to prepare a report. The Owners and the Engineer agreed to this suggestion for the sake of fairness and to show good faith. The results of this EPS Consultants findings and recommendations came as a shock to all as it overturned all the previous investigations and findings completely. This report and its conclusions needed to be discussed at length as the ensuing response to these conclusions established the actual problem and solution. The report by the EPS Supplier’s Consultant laid the blame squarely on the Prime Contractor and the Engineer and almost dismissed the responsibility of the EPS Supplier for substandard products by a slap on the wrist.
Fortunately, this report was proven to be flowed as it made conclusions on the basis of numbers or figures which could not be supported by calculations. How this was done is the main purpose of this paper. The procedures employed by the Engineer in doing so lays the groundwork for resolution of similar problems and avoidance of litigation.
The New Zealander Consultant hired by the EPS supplier concluded that: The cracking was mainly due to shrinkage and it identified the following as the major contributing factors to the shrinkage 2]:
⦁ “Inadequate shrinkage control measures in the floor slab design. ⦁ Excessive water in the concrete mix causing shrinkage of up to four times what would have been expected from the specified mix”
While recognizing that the “underfloor Polystyrene Supplied is below specified density” this observation was not pursued further in terms of its contribution to the slab cracking! The EPS Consultants report totally neglected the contribution of the very low subgrade support offered by the substandard polystyrene supporting those slabs despite the crack patterns and also ignoring the conclusions of two other Independent Consultants attributing the cracking to the substandard EPS.
It also recommended an arbitrary apportionment of liability that pinned the responsibility mainly on the Designer and Main Contractor. While the EPS Consultants report was flawed because it made general conclusions without having any basis or calculations to support these, it also proved that:
The as laid concrete had a very high water cement ratio (W/C = 0.833)3] which is almost double the specified water cement ratio (W/C < 0.42).
It supported the findings on the core strengths obtained.
REVIEW OF THE EPS CONSULTANTS FINDINGS
As earlier stated, the report caused some shock and alarm to the Owner and as the Engineers we were asked to comment on this report. Our review of this report showed that:
The report was flawed because it predicted the strain on the as designed slab as 0.350mm/m (350 millionths) which later on turned out to be unsupported by any calculations!
The report dealt with qualitative assessment that was based on generalized assumptions leading to erroneous conclusions particularly on the assignment of responsibility.
The EPS Consultant concluded, unsupported by engineering calculations, that the concrete wear slab as designed and as-built would have cracked in the same manner. This erroneous conclusions is due to their failure to quantify by calculations the shrinkage strains which would result from the as-designed and as-poured mixes. This is due to the non recognition of th shrinkage control measures specified by the Designer which included:
Control of W/C to 0.42
Limiting slump to 2 inches (50mm)
Increased strength of concrete to 5,000 psi minimum by specifying W/C to be 0.42 maximum.
Shrinkage control rebars
Extended curing period of 14 days by ponding
Specified use of SCC or Fly Ash (which was not carried out with the knowledge of the Owner)
Requirement for full enclosure before pouring of slabs.
The EPS Consultant would cursorily dismiss these measures no being “insufficient” (based on a letter dated 15 February 1997).
Herein lies the crux of the matter because we shall prove subsequently, and supported by calculations, that the measures specified were more than adequate to control cracking. Thus, although it resulted in countless hours of engineering time and research, the study was worth it for it clearly proved that the specifications were adequate to prevent cracking despite the non use of the originally specified SCC or even in the “absence” of Fly Ash.
It also emphasizes the fact that sound Engineering can always stand on solid ground and rely on Fundamental Engineering Principles despite efforts to mask the truth. The EPS Consultants report was proven without basis and is flawed because it can not support its shrinkage quantification of 0.350 mm/m in the light of our calculations showing that the shrinkage strains resulting from the as- specified concrete mix was well below the critical threshold strain magnitude for cracking to start (0.200mm/m or 200 millionths).
SUMMARY OF TEST RESULTS
The tests on concrete and EPS cores are included as Table “A” and Table “B” in Appendix “C”. In addition, the water cement ratio on the hardened cores as performed by BRANZ showed that the W/C Ratio is 0.833 average. These tests results already clearly established that the materials as used were substandard and grossly non complying with the specifications.
CALCULATIONS AND QUANTIFICATION OF SHRINKAGE STRAIN MAGNITUDE
The Methodology and procedures employed strictly followed the universally accepted ACI 209R-92. The calculations showed that:
Although the ultimate strains εsh were 290 millionths and 1020 millionths for the as-specified and as-poured concrete smaller values were obtained when various correction factors are applied as provided for in ACI 209R-92. The large disparity is in the very high Water Content of 47.9 gals/CY for WC 0.833 for the as poured concrete.
Shrinkage correction factors were equally applied for the as- specified and as poured concrete mix. The product is 0.3654 the resulting strains are:
3. The environmental and other considerations are very important in quantifying shrinkage strains and whether such conditions would cause cracking of the slab.
4. These environmental and other factors and their contribution and effect to the shrinkage magnitude are very important and highlight the fact that shrinkage can be controlled by controlling these factors.
The calculations and references are included in this paper as an appendix as a guide to the reader.
CONCLUSION
As a result of the foregoing findings and computations, the EPS supplier’s consultant did not anymore respond nor repute the results of our studies. The EPS supplier and the main contractor entered into a compromise agreement with the Owner and the Engineer of Record was totally cleared of any responsibility or liability.
1] Since the compressibility modulus of the EPS (Ey) can be directly correlated to the density [Horvath], the settlement of the EPS can be predicted.
2] “Floor Failure Report” Dec 1997 by New Zealander Consultant.
3] Average Value of W/C from Building Research Authority NZ (Branz)