Concrete compression testing is a fundamental test procedure for civil engineering and construction quality control and assurance used to evaluate the strength and quality of concrete. This procedure involves applying a compressive load to a cylindrical specimen until failure occurs. It is conducted in a controlled laboratory setting adhering to specific standards and protocols.
The results of concrete compression testing is focal in assessing the load-carrying capacity and structural performance of concrete in various construction applications, including buildings, bridges, pavements, and infrastructure projects. Structural and field engineers rely on these test outcomes to verify that the concrete meets the necessary strength and safety requirements.
Concrete testing generally follows a procedure that involves the following:
Sample Preparation:
Concrete specimens are cast in standardized molds, typically cylinders with a diameter of 150 mm (6 inches) and a height of 300 mm (12 inches). The specimens undergo careful compaction and curing under controlled conditions to achieve the desired strength.
Testing Apparatus:
The prepared concrete specimens are placed in a compression testing machine, which applies a progressively increasing load to the specimen. Equipped with load cells and a digital display, the machine accurately measures the applied force.
Loading Procedure:
The test commences with a pre-loading phase, during which a small load is applied to eliminate any irregularities or gaps between the specimen and the testing machine. Subsequently, the main loading phase ensues, gradually increasing the load at a specified rate until the concrete sample reaches failure.
Failure Criteria: Failure of the concrete specimen is determined when it can no longer withstand the increasing load, causing the measured resistance to decrease. The maximum load the sample sustained before failure occurs is recorded as the compressive strength of the concrete.
An ISO-accredited materials testing laboratory is a lab that has received official certification for meeting the standards and requirements established by the International Organization for Standardization (ISO). ISO is an independent global organization that develops and publishes standards to ensure consistency, quality, and safety across various industries and sectors.
To obtain ISO accreditation, a materials testing laboratory undergoes a rigorous evaluation conducted by an independent accreditation body. The lab must demonstrate its competence, technical proficiency, and adherence to specific ISO standards relevant to its field of testing. The accreditation process involves a thorough assessment of the lab’s management system, equipment, staff qualifications, testing procedures, quality control measures, and data reporting practices.
Earning ISO accreditation is a significant accomplishment that validates the laboratory’s ability to produce precise and reliable test results. It provides assurance to clients, regulators, and other stakeholders that the lab operates with a high level of proficiency and complies with globally recognized standards. The ISO accreditation typically includes a defined scope, specifying the types of materials testing the lab is accredited to perform.
For materials testing laboratories, ISO/IEC 17025 is the standard commonly used for accreditation. This standard outlines the general requirements for the competence of testing and calibration laboratories and covers aspects such as staff qualifications, equipment calibration, testing methods, quality assurance, and results reporting. By obtaining ISO/IEC 17025 accreditation, materials testing laboratories demonstrate their dedication to providing accurate and dependable test data to support industries, engineering projects, construction, and research endeavors.
Philippine GeoAnalytics Inc is the first ISO-accredited testing laboratory in the Philippines and continues to provide testing services that are compliant with international standards. We strive and remain to be the trusted testing laboratory of choice.
Mechanically Stabilized Earth (MSE) walls and slopes are innovative solutions for ground stabilization and earth retention. At PGATECH Group, we offer cutting-edge MSE technologies designed to enhance the stability and durability of infrastructure projects. This article explores what MSE walls and slopes are, their history, purpose, advantages, applications, desirability, and the problems they address.
What are Mechanically Stabilized Earth (MSE) Walls and Slopes?
Mechanically Stabilized Earth (MSE) walls and slopes are structures that use layers of engineered materials to stabilize and retain soil. These systems typically consist of compacted backfill, reinforcing elements (such as geogrids or metal strips), and a facing material (such as concrete panels, blocks, or natural vegetation). MSE walls and slopes are designed to support heavy loads and prevent soil erosion, making them ideal for various construction projects.
History of Mechanically Stabilized Earth (MSE) Walls and Slopes
The concept of MSE dates back to ancient times when natural materials were used to stabilize embankments. In the 1960s, innovative use of steel strips and compacted soil layers revolutionized earth retention techniques. Since then, advancements in materials and engineering practices have further refined MSE systems, making them a preferred choice for many infrastructure projects worldwide.
With production of stronger and better quality geosynthetics and its increase in use in the geoconstruction industry, MSEs reinforced with geosynthetics started being referred to as Geosynthetic Reinforced Soil (GRS) or Geosynthetically Confined Soil (GCS). This modern type of MSE Walls has proven to be a better choice because of its lightweight reinforcement that provides internal stability with more reliable, closer spacing between lifts.
What is the Function/Purpose of Mechanically Stabilized Earth (MSE) Walls and Slopes?
The primary purpose of MSE walls and slopes is to provide effective soil stabilization and earth retention. Key functions include:
Supporting Loads: MSE systems can support heavy structural loads, making them ideal for retaining walls, bridge abutments, and embankments.
Preventing Erosion: The reinforced structure prevents soil erosion, maintaining the integrity of slopes and embankments.
Improving Stability: Enhances the overall stability of the soil, reducing the risk of landslides and slope failures.
Aesthetic Integration: MSE walls and slopes can be designed to blend seamlessly with the surrounding environment, providing both functional and aesthetic benefits.
What Do Mechanically Stabilized Earth (MSE) Walls and Slopes Replace?
MSE walls and slopes often replace or complement traditional earth retention methods such as:
Gravity Retaining Walls: Concrete or masonry walls that rely on their mass to resist soil pressure.
Cantilever Retaining Walls: Reinforced concrete walls that use a cantilevered design to stabilize soil.
Gabion Walls: Structures made of wire baskets filled with rocks or other materials.
Natural Slopes: Unreinforced slopes that may be susceptible to erosion and instability.
These traditional methods can be more expensive, labor-intensive, and less adaptable to various project conditions compared to MSE systems.
Advantages of Mechanically Stabilized Earth (MSE) Walls and Slopes
MSE walls and slopes offer numerous advantages, including:
Cost-Effectiveness: Lower material and labor costs compared to traditional retaining walls.
Speed of Construction: Faster installation process, reducing overall project timelines.
Flexibility: Adaptable to a wide range of soil types and site conditions.
Durability: Long-lasting performance with minimal maintenance requirements.
Environmental Benefits: Can be designed with natural vegetation, promoting ecological sustainability.
Where are Mechanically Stabilized Earth (MSE) Walls and Slopes Applicable?
MSE walls and slopes are applicable in various scenarios, such as:
Highway and Railway Embankments: Providing stable support for transportation infrastructure.
Bridge Abutments: Supporting bridge structures and connecting them to roadways.
Retaining Walls: Stabilizing soil in residential, commercial, and industrial developments.
Slope Stabilization: Reinforcing slopes to prevent landslides and erosion.
Landscaping: Creating aesthetically pleasing and functional terraced landscapes.
Flood Control: Constructing levees and floodwalls to manage water flow and prevent flooding.
What Makes Mechanically Stabilized Earth (MSE) Walls and Slopes Desirable?
The desirability of MSE walls and slopes stems from their:
Efficiency: Rapid construction and effective soil stabilization.
Economic Savings: Lower overall project costs due to reduced material and labor expenses.
Minimal Disruption: Less invasive construction methods compared to traditional retaining walls.
Versatility: Suitable for a variety of applications and environmental conditions.
Aesthetic Appeal: Can be designed to blend with natural surroundings, enhancing visual appeal.
Problems Addressed by Mechanically Stabilized Earth (MSE) Walls and Slopes
MSE walls and slopes effectively address several engineering challenges, including:
Soil Instability: Reinforces weak soils to support structural loads and prevent failure.
Erosion Control: Prevents soil erosion on slopes and embankments.
Space Constraints: Provides effective earth retention in limited space, allowing for vertical construction.
Load Support: Supports heavy loads in infrastructure projects such as highways and bridges.
Environmental Impact: Reduces the need for extensive excavation and concrete usage, promoting sustainability.
Mechanically Stabilized Earth or MSE Walls are support systems that are used in construction projects to help control and support slopes or soil on inclines. This technology combines soil reinforcement and a facing system to provide support. MSE Walls are mostly used in highway and railway embankments, bridge abutments and other projects where soil slopes require stabilization/retention. MSE Walls are favored for their cost effectiveness and versatility in construction projects. An MSE Wall has 3 main components that help fulfill its purpose.
Reinforcement
One of the three main components is the reinforcement. The reinforcement can come in various forms such as steel strips or geogrids which are embedded within the soil mass creating a stable composite body. The reinforcement aids the wall in such a way that it distributes lateral forces and improves the overall strength of the wall.
BackfillThe second component would be the backfill. To fill the space between the reinforcement layers, certain backfill types with known properties are used. This includes Granular Backfill, Cohesive Backfill, and reinforced soil
Granular Backfill
The granular backfill is the most common type of backfill used for MSE walls. It contains well graded and compacted granular materials that provides reliable interparticle friction resistance, and at the same time promotes interaction with the reinforcements.
Cohesive Backfill
This type of backfill contains cohesive soils such as clay or silt. Cohesive backfill is rarely employed in situations where granular material is scarce. The strength from this backfill mainly comes from cohesion and internal shear strength of the material.
Reinforced Soil
Reinforced soils are fill materials mixed with reinforcing elements to upscale its shear strength and tensile properties. This type of backfill is only used in some cases where design specifications require higher strength.
Facing
The last component of the MSE wall is the facing. The facing is the front and visible surface of the MSE Wall. This component shields the wall from erosion. It also provides an aesthetic surface for the structure. Common facing techniques include: (a) wrap-around system which can be used to cultivate a vegetative face after several weeks; (b) gabions that are multipurpose and can be used with surfaces that are exposed to bodies of water; and (c) concrete panels used for vertical walls applications typical for abutments and other highway constructions.
Conclusion
At PGATECH Group, we are dedicated to providing state-of-the-art Mechanically Stabilized Earth (MSE) Wall – Geosynthetic Reinforced Soil (GRS) or Geosynthetically Confined Soil (GCS) – and slope solutions that ensure the stability and durability of your construction projects. Our expertise and advanced techniques enable us to tackle even the most challenging ground stabilization tasks, delivering reliable and cost-effective results. For more information about our MSE services, please contact us today.
Geopiers, also known as Rammed Aggregate Piers (RAPs) or Rammed Aggregate Columns (RACs), are an innovative ground improvement technology used to enhance soil bearing capacity and control settlement. At PGATECH Group, we specialize in providing top-notch RAP solutions tailored to meet the specific needs of your construction projects. This article delves into the details of what RAPs are, their history, purpose, advantages, applications, desirability, and the problems they address.
What are Rammed Aggregate Piers (RAPs) / Geopiers?
Geopiers, commonly referred to as RAPs (Rammed Aggregate Piers), are ground improvement elements created by densely compacting aggregate (crushed stone) into drilled holes in the ground. These piers or stiff columns reinforce weak soils, providing a robust foundation that can support heavy structural loads and reduce settlement.
History of Rammed Aggregate Piers (RAPs) / Geopiers
The concept of using aggregate to improve soil properties dates back to the early 20th century, but the modern technique of Rammed Aggregate Piers was developed in the early 1990s. The Geopier system was introduced as an alternative to deep foundations, offering a cost-effective and efficient method for ground improvement. Over the years, the technology has evolved, with advancements in installation techniques and equipment, making RAPs a reliable choice for many construction projects.
Rammed Aggregate Piers (RAPs) / Geopiers in the Philippines
Since October of 2000, the patented Rammed Aggregate Pier System has been used to support virtually all types of structures ranging from warehouses, tanks, embankments, low-rise to mid-rise buildings, MSE Walls, GRS Walls, and more.
Our clients from various industries have retained our services in their projects across the nation. Our team of experts and skilled personnel have also worked on government projects as Rammed Aggregate Columns have been recognized as a locally proven technology to support roadways and publicly-owned buildings.
What is the Function/Purpose of Rammed Aggregate Piers (RAPs) / Geopiers?
The primary purpose of RAPs/Geopiers is to improve the load-bearing capacity and reduce settlement of weak soils. The key functions include:
Increasing Bearing Capacity: Enhances the strength of weak soils to support structural loads.
Reducing Settlement: Controls and limits both total and differential settlement of structures.
Improving Stability: Provides additional stability for foundations on problematic soils.
Enhancing Soil Performance: Facilitates better load distribution and soil reinforcement.
What Foundation Systems Can Rammed Aggregate Piers (RAPs) / Geopiers Replace?
RAPs/Geopiers often serve as an effective alternative for more traditional and sometimes more expensive foundation solutions such as:
Deep Foundations: Piles, drilled shafts, and caissons, which can be more costly and time-consuming to install.
Over-Excavation and Replacement: Removing and replacing poor soil with engineered fill, which involves extensive excavation and material handling.
Soil Stabilization Methods: Chemical grouting and soil mixing, which may not always be cost-effective or environmentally friendly.
Advantages of Rammed Aggregate Piers (RAPs) / Geopiers
RAPs/Geopiers offer several advantages, including:
Cost-Effectiveness: Generally less expensive than deep foundation systems.
Time Efficiency: Faster installation compared to traditional deep foundations.
Flexibility: Suitable for a wide range of soil types and project conditions.
Environmental Benefits: Uses natural materials (aggregate) and minimizes soil disturbance.
Performance: Provides reliable improvement of soil bearing capacity and reduction of settlement.
Where are Rammed Aggregate Piers (RAPs) / Geopiers Applicable?
RAPs/Geopiers are applicable in various scenarios, such as:
Commercial and Residential Buildings: Enhancing foundation support for buildings on weak soils.
Industrial Facilities: Supporting heavy machinery and storage areas.
Infrastructure Projects: Roads, highways, bridges, and railways.
Embankments and Slopes: Stabilizing slopes and embankments to prevent landslides.
Wind Turbines and Utility Structures: Providing a stable foundation for tall and heavy structures.
What Makes Rammed Aggregate Piers (RAPs) / Geopiers Desirable?
RAPs/Geopiers are highly desirable for several reasons:
Efficiency: Quick installation process minimizes construction delays.
Economic Savings: Lower overall project costs due to reduced material and labor requirements.
Minimal Disruption: Less invasive installation compared to traditional deep foundations.
Versatility: Adaptable to a variety of soil conditions and structural requirements.
Sustainability: Environmentally friendly approach using natural aggregates.
Problems Addressed by Rammed Aggregate Piers (RAPs) / Geopiers
RAPs/Geopiers effectively address several common soil and foundation problems, including:
Low Bearing Capacity: Enhances the ability of weak soils to support structural loads.
Excessive Settlement: Controls and reduces settlement, ensuring long-term structural integrity.
Differential Settlement: Mitigates uneven settlement, which can cause structural damage.
Construction Delays: Speeds up the foundation preparation process, allowing for timely project completion.
Conclusion
At PGATECH Group, we are committed to delivering high-quality Rammed Aggregate Pier / Geopier solutions that ensure the stability and durability of your construction projects. Our expertise and advanced techniques guarantee that even the most challenging soil conditions are effectively managed. For more information about our RAP/Geopier services, please contact us today.
Ground improvement is a crucial aspect of modern construction and civil engineering. At PGATECH Group, we specialize in delivering state-of-the-art ground improvement solutions to ensure the stability, safety, and longevity of your projects. In this comprehensive article, we will explore what ground improvement is, its history, functions, advantages, applications, desirability, and the problems it addresses.
What is Ground Improvement?
Ground improvement refers to a range of techniques used to enhance the physical properties of soil. These techniques are designed to increase the load-bearing capacity, reduce settlement, and mitigate liquefaction potential in soils. Ground improvement is essential for construction projects on sites with poor soil conditions, ensuring that structures are built on a stable and secure foundation.
History of Ground Improvement
The concept of ground improvement dates back to ancient times, where early civilizations used basic methods to stabilize and strengthen soil. Techniques such as compaction and the use of natural binders like lime and clay have evolved significantly. In the modern era, the development of advanced materials and machinery has revolutionized ground improvement practices, allowing for more efficient, effective, and flexible solutions.
What is the Function/Purpose of Ground Improvement?
The primary purpose of ground improvement is to enhance the properties of soil to meet specific engineering requirements. This includes:
Increasing load-bearing capacity
Reducing soil compressibility
Preventing soil liquefaction during seismic events
Mitigating settlement issues
Enhancing the stability of slopes and embankments
By improving these properties, ground improvement ensures the safety and durability of structures built on challenging soil conditions.
What Does Ground Improvement Replace?
Ground improvement techniques often serve as alternatives to more traditional and costly methods such as:
Deep foundations (e.g., piles, drilled shafts)
Excavation and replacement of poor soil
Massive over-excavation followed by backfill with engineered materials
These traditional methods can be time-consuming, expensive, and disruptive. Ground improvement offers a more cost-effective and less intrusive solution.
Cost-Effectiveness: Reduces the need for expensive deep foundation systems.
Speed: Techniques can be implemented quickly, reducing construction time.
Flexibility: Applicable to a wide range of soil types and project conditions.
Sustainability: Often uses environmentally friendly materials and methods.
Performance: Enhances the mechanical properties of soil, ensuring long-term stability and safety.
Where is Ground Improvement Applicable?
Ground improvement is applicable in a variety of scenarios, including:
Construction of buildings, bridges, and other infrastructure on soft or loose soils.
Road and railway embankments.
Port and harbor facilities.
Land reclamation projects.
Industrial and commercial developments.
Areas prone to seismic activity where soil liquefaction is a concern.
What Makes Ground Improvement Desirable?
Ground improvement is highly desirable due to its ability to address challenging soil conditions without the need for extensive excavation and replacement. Its benefits include:
Efficiency: Quick and effective enhancement of soil properties.
Economic Viability: Lower overall project costs compared to traditional methods.
Minimized Disruption: Less invasive techniques lead to fewer disturbances to existing structures and the environment.
Versatility: Can be tailored to specific project needs and site conditions.
Problems Addressed by Ground Improvement
Ground improvement techniques effectively address several soil-related problems, including:
Poor Load-Bearing Capacity: Enhances the soil’s ability to support structures.
Excessive Settlement: Reduces overall and differential settlement, preventing structural damage.
Soil Liquefaction: Stabilizes soils in seismic zones, reducing the risk of liquefaction.
Slope Instability: Increases the stability of slopes and embankments, preventing landslides and mass wasting.
Erosion Control: Protects natural and man-made slopes against soil erosion in sloping ground, adjacent slope faces, coastal and riverbank areas.
Types of Ground Improvement
Ensuring the safety of your project starts with the sound engineering of building foundation and stabilization of potential geohazards. Although reinforced concrete and steel structures are reliable and popular options, optimizing the benefit-cost ratio demands more flexible engineering solutions that address geotechnical issues at their core. In general, these geotechnical solutions are commonly termed as ground improvement.
A variety of ground improvement techniques have been developed to address soil and rock conditions that don’t meet project requirements. Common issues stem from poor engineering properties on-site such as insufficient soil bearing capacity, excessive settlement projections, high liquefaction potential, unstable slope/excavation, etc.
Ground improvement techniques can be categorized into the following main types according to mechanism: densification, reinforcement, drainage, chemical treatment, and others.
Densification
Surface compaction, one of the most common procedures employed on-site, is a form of densification. These methods generally increase the density of the soil thereby improving strength and deformation properties, and reducing liquefaction potential. Several methods can be conducted to densify the soil depending on the soil type and the target depth to be improved. For shallower layers, dynamic compaction can be applied which involves dropping weights on the ground surface through a specified height at predetermined locations. For intermediately deeper granular layers, vibroflotation can be conducted by inserting a probe into the ground inducing vibrations that densify the ground.
Reinforcement
A multitude of methods of ground improvement fall under the reinforcement category. Techniques vary depending on the orientation of the installation, reinforcing material, and method of installation. Slope stabilization can be carried out using soil nails or rock anchors. Soft soil or weak, loose soil can be improved by stone columns, sand compaction piles, jet grouting, micropiles, and Rammed Aggregate Piers. The construction of mechanically stabilized earth (MSE) structures also involve the use of steel or geosynthetic reinforcements to increase load bearing capacity and stability. Some techniques such as rammed aggregate piers can virtually lower liquefaction potential.
Drainage
Drainage of pore water from consolidating clayey soils can increase overall soil strength. Moreover, consolidation settlements are also accelerated to eliminate future instability problems as much as possible. By installing prefabricated vertical drains, the pore water can be expelled faster than normal. Addition of surcharge preloading or use of vacuum pressure can accelerate the consolidation process even more.
Chemical Treatment
The use of chemical admixtures to improve intrinsic strength properties of the soil and control hydraulic conductivity have also been developed for medium to large scale applications. Problems with swelling soils can also be alleviated by these methods.
Overall, ground improvement techniques have been continuously developing for several decades giving rise to an array of alternatives to choose from. However, selecting the most viable method for a project is not a simple task. Proper technical analysis coupled with expertise honed from years of experience can guarantee that the appropriate technique selected prioritizes safety without compromising financial viability. PGATech maintains a portfolio of well-developed ground improvement technologies that have been applied in different projects across the Philippines with notable success.
Conclusion
At PGATECH Group, we are committed to providing cutting-edge ground improvement solutions that ensure the success of your construction projects. Our expertise and advanced techniques enable us to tackle even the most challenging soil conditions, delivering stable, safe, and sustainable foundations. Check our services for available options or contact us for specific solutions suited to your project. For more information about our ground improvement services, please contact us today
ABSTRACT: Quench Tempered (QT) or Thermo Mechanically Treated (TMT) rebars have crept into the market replacing the Micro alloyed (MA) steel rebars almost completely without the knowledge of the Design Engineering Community as well as the end users.
The proponents of QT/TMT rebars have stated that since these rebars have comparable Physical Test Performance when subjected to Static Tension and bend tests, then it could be a viable and safe replacement to MA rebars without qualification. Herein is where the danger lies, because QT/TMT rebars behave quite differently under Cyclic loading and are also very much affected by heating, welding, bending, galvanizing and threading procedures employed in their use particularly in high rise buildings under Seismic Zone 4.
Advanced countries have warned against these dangers and we believe it is our duty to inform the public and the Profession of the dangers associated with their use in Seismic Zone 4.
In a recent ASEP dialogue with the representatives of the Rebar manufacturing sector conducted together with representatives of the Bureau of Research and Standards, claims have been made that the rebars can be welded and used in high rise buildings under Seismic Zone 4 Conditions. This claim is very far from the truth and at best could only be done so under very strict qualifications. We have asked the Industry representatives to submit proof to prove their claims. This was received 18 March 2010 but still do not offer any satisfactory explanation as to performance under cyclic loading in a severe earthquake environment.
The premature and relatively localized and very limited yield zones of QT/TMT rebars under repeated Cyclic Loadings would result in spalling of the concrete cover in Reinforced Concrete columns and failure of the affected rebars by premature buckling and eventual tension failure of the rebars.
Various studies and research in Italy 2], New Zealand and elsewhere have pointed to the Dangers posed by these rebars when used in Seismic Zone 4.
This paper is aimed at alerting the Engineering Community to the uninformed use of QT/TMT rebars in order to reduce the dangers posed by such usage.
1 INTRODUCTION
The Structural engineering practitioners are faced with problems involving material selection. But nowhere has this been more acute than in the use of reinforcing bars that do not meet design demands in Seismic Zone 4 particularly as it applies to cyclic loading under seismic excitation.
The problems particularly are related to the use of Quench Tempered (QT) or Thermomechanically Treated (TMT) Rebars and accentuated by the noticeable artificial absence of the commonly used and previously available Microalloy (MA) rebars. Thus, the engineering community is deprived of a safe choice and left with a rebar that strongly affects the structural performance and adequacy of our designs in a retrogressive way under cyclic loading.
But first let us try to define each of these processed steel types:
1.1 Quench Tempered (QT) Rebars
The QT or TMT bar is manufactured by rapid cooling of plain low Carbon steel by a fine water spray. The quenched surface is tempered by the heat of the red hot core. This results in a layered steel rebar section with a heat treated outer skin (high tensile strength of tempered martensite and a ferrite/pearlite core with slow cooling inner core. The end result is a steel bar with a higher composite yield and tensile strength than the parent material to start with.
1.2 Microalloyed (MA) Steel Rebars
The micro-alloyed steel derives its strength from alloying materials specifically vanadium and Carbon and consists of a uniform material cross section manufactured from steel billets. The alloys are added in the heat. This is the commonly used Rebar until it suddenly disappeared in the marketplace.
1.3 Comparison of QT/TMT Rebars vs. Microalloyed (MA) Rebars3]
Major research in highly advanced countries have pointed the problems associated with QT/TMT Rebars. This is clearly indicated in the publication by Bothara. 3]
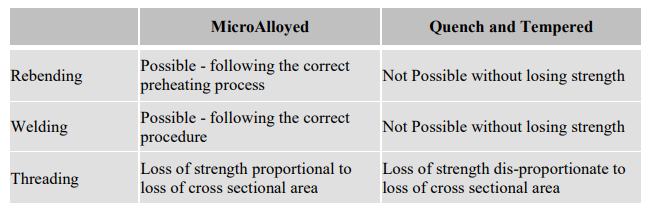
Table 1. Comparison of performance between MA & QT/TMT Rebars
1.3.1 Why have MA Rebars Disappeared in the Market?
Microalloyed rebars began disappearing in the market when most major local manufacturers completely shifted to QT/TMT rebars. In the dialogue with steel Industry representatives and ASEP with BRS, the representatives claimed that Microalloyed (MA) rebars are more expensive to produce because the alloys were expensive. Thus, in the blink of an eye, the public and the engineering design profession were deprived of a “healthy” choice that will not cause endangerment to structures.
1.3.2 Why the Endangerment?
There is a clear and present danger in the use of QT/TMT rebars in Seismic Zone 4 due to the non-ductile behavior of QT/TMT rebars under conditions that are typical or common in local Construction practice.
In addition, there are critical considerations that may be difficult for QT/TMT to meet under various conditions that it will be exposed to, such as Fire exposures and retempering due to inappropriate welding, contrary to the very strict procedures imposed on the welding of QT/TMT rebars, as well as critical outer skin loss when these are threaded for mechanical couplers4.
In addition, Performance in highly critical cyclic Seismic Loading is put to question.
The premature and relatively localized and very limited yield zones of QT/TMT rebar under repeated Cyclic Loadings would result in spalling of the concrete cover in Reinforced Concrete columns and failure of the affected rebars by premature buckling.5] Various studies and research in Italy, New Zealand and elsewhere have pointed to the Dangers posed by these rebars when used in Seismic Zone 4.
This paper is aimed at alerting the Engineering Community to the uninformed use of QT/TMT rebars in order to reduce the dangers posed by such usage.
The author seeks to highlight these problems in order for the engineering community to realize the dangers associated with the use of QT/TMT rebars so that these could be better understood.
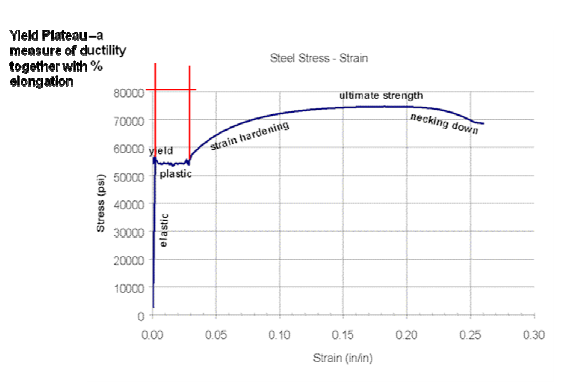
2 STATIC STRESS STRAIN DIAGRAM
The static Stress vs Strain diagram of common steels is depicted in the Diagram below. The important thing to consider here is the size of the Yield Plateau or the Ductility of the Steel which is a function of both the TS/YS ratio as well as the % Elongation.
As can be seen from the Diagram at the right, the Yield Plateau initiates upon yielding and propagates almost horizontally. This indicates that straining occurs even without a proportional increase in stress until Strain Hardening sets in and a significant stress increase occurs before reaching the ultimate tensile failure condition which is the peak of the curve. A rapid decay in the stress occurs with decreasing steel cross sectional area due to necking.
A very important consideration is the length of the Yield Plateau represented by the TS/YS Ratio and the % Elongation. PNS 49 requires a minimum TS /YS Ratio of 1.25 as most other International Codes in high Seismic Risk areas. In addition minimum elongation values required are 12 % to 16 % for Weldable Steel. In addition, a cap of 540 MPa is placed on the yield Strength of Weldable steel bar for Grade 415 W Steel.
Why is there a cap on the Yield Stress?
There is a cap of 540 MPa on the yield stress for Grade 415 steel rebar in order to ensure that yielding will occur on the steel first before the concrete. Otherwise, concrete failure which is an explosive type of failure will occur contrary to the expectations of the designer.
3 WHAT INTERNATIONAL CODES SAY
NZ Standard 3101:2006 Concrete Structures Part 1 Section 5.3.2.2 “Restrictions on in-line quenched and tempered process shall not be used where welding, hot bending, or threading of bars occurs.”
“It is important to note that any process involving heat e.g. Welding, galvanizing and hot bending adversely affect the mechanical properties of quench and tempered reinforcing bars by modification of the microstructure.
NZ Standard 3101:2006 Concrete Structures Part 2 Section C-5.8.2 In Line quenched and tempered steel bars Welding of in-line quenched and tempered bars can have detrimental effects on the strength and ductility of the bars and associated connection. AS 3600 requires designers to assume that the strength of such reinforcement has a design strength of 250 MPa when raised to the temperature associated with welding, galvanizing or hot bending. Such a requirement is considered inappropriate in a seismically active country where concentration of yielding at a weld position would be undesirable and could result in brittle failure. (Empasis by author)
4 THE PROBLEMS ASSOCIATED WITH QT/TMT BARS
4.1 Local Studies Presented by PISI 6]
In a written communication by the PISI dated February 10, 2010 7] addressed to ASEP, a report by MIRDC 8] was attached and furnished to ASEP in response to the ASEP request during the dialogue.
In the attached report, it was concluded that the QT/TMT rebar’s TS/YS ratio “is attainable” (NOT Categorically COMPLYING) as results indicate that the rebars tested are marginally lower than the minimum 1.25 Ratio required in most instances.
The abstract8] summarizes the study and which we quote verbatim as follows:
“Characterization of Locally manufactured Tempcore Steel reinforcing steel bars (rebars) produced by the QST process was undertaken to ascertain its mechanical properties in relation to established standards as well as meet requirements of structural Engineers. Different sizes of Tempcore rebars gathered from two local manufacturers were subjected to chemical analysis, tensile testing and metallography on the as- received, heat treated and welded basis. Locally produced Tempcore rebars can be manufactured to meet established domestic standards particularly on meeting a tensile to yield (TS/YS) ratio of ≥ 1.25. Yielding characteristics as required by structural engineers can be satisfied by Tempcore Rebars. Heating at temperatures up to 500 degrees C does not affect mechanical properties, although increasing this Temperature to 700 Deg C reduces the Yield and tensile Strength. Although CE values may indicate weldability, inconsistent properties may be obtained for smaller sizes of rebars. The use of AWS E 10018 produces better properties on welding of Tempcore rebars than using the more commonly available AWS 7018 Electrodes. Stress relieving after welding improves mechanical characteristics of Tempcore rebars.” (Underlining by author)
The test results and studies made on static tensile tests and do not include cyclic loading conditions.
4.2 Welding Associated Problems
“Welding of any kind to QT steel will reduce its strength and must not be attempted. The welding temperatures far exceed 700oC in most common instances leading to distempering of the rebars.
Welding of QT Grade 500E steel should not be allowed under any circumstances. This includes welding of bars to achieve electrical continuity. For such applications, it is unlikely that Grade 500E steel will be required and other more weldable steels should be chosen.4]
In summary, designers should not rely on welding of Grade 500E steel and fabricators/contractors should not allow welding of this material.9”
Welding a Quench and Tempered (QT) reinforcing bar raises the steel above the temperature it was tempered at and without the controlled quench and temper process it will cool slowly back to ambient temperature. Through this cycle it will lose the strength of its external case and revert back to steel with much lower yield strength. Micro-Alloy (MA) weldable reinforcing steel can be welded such that it maintains its ductility and its strength using ordinary E70XX Electrodes.
CONCLUSIONS IN NEW ZEALAND STUDY 9]
Q&ST Grade 500 reinforcing can not be welded without strength loss. It is recommended that a suitable warning be added to the Standard to this effect. This is covered in the amendment to NZS 3101(7)
The standard implies that lap welds are possible with Grade 500E but testing suggests that lap welding to the Standard specified requirements does not provide a sufficient margin against failure of the weld before failure of the bar(2). This is addressed in NZS 3101, however, it is recommended that appropriate amendments also be made to AS/NZS 1554.3 to warn specifiers/designers/constructors of the likely performance of this detail
The Standard implies that butt-welding of Grade 500 E reinforcing steel is possible but is silent on the performance expected. Discussion at the recent seminars on Grade 500E reinforcing steel indicated that currently there may not be a suitable welding electrode available to provide confidence that failure will always occur in the steel rather than the weld when the bars are at the higher end of the maximum tensile strength range allowable in AS/NZS 4671 and the bars containing the weld are required to yield at over strength. Although this issue is covered in the amendment to NZS 3101, it is essential that it is also addressed in AS/NZS 1554.3 as butt-welds complying with the Tables in this Standard are deemed to be pre-qualified and could be assumed to be capable of developing the strength of the bar, unless warnings are given to the contrary.
4.3 Results of the MIRDC Study
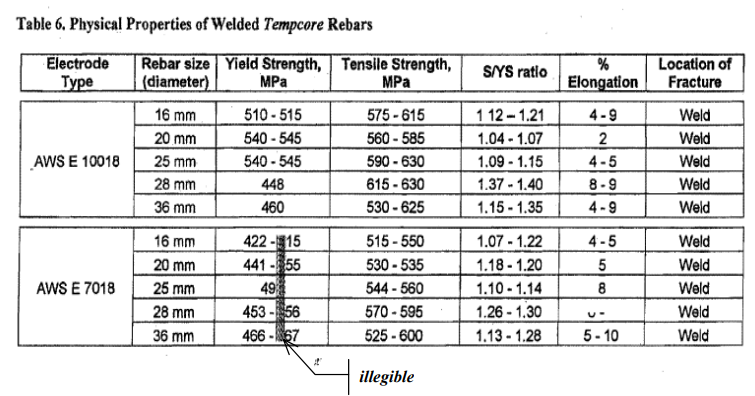
The results of the MIRDC study by Dr. Fudolig10] kindly furnished by PISI for ASEP Consideration indicates results that clearly show the mechanical performance of welded QT/TMT rebars using two Electrode types on different rebar Diameters.
Table 6 above from the MIRDC study11] shows the reduction in the Tensile strength and yield strengths and corresponding TS/YS ratio for welded joints for both AWS 10018 and AWS E 7018 Electrodes Types. What is more critical is the observable marked reduction in % Elongation for most of the rebars whether welded with the more expensive E 10018 Electrodes or the Standard E 7018 Electrodes.
The % Elongation results for the welded joints would not meet the requirements of PNS 49 2002 12for Grade 415 W Weldable Steel, which require a minimum range of 12 % to 16 % Elongation under a Static Tension test. A lack of elongation limits the straining region resulting in premature spalling and failure of the concrete cover in turn leading to premature buckling and eventual tensile failure.
4.4 But where is the Economy?
The savings obviously accrue only to the manufacturers as the cost of producing QT / TMT rebars is very much less than MA rebars. However, this does not translate to savings to the end user as the cost of welding and the required welder skills are much more stringent than ordinary MA rebars if the correct procedures are followed, even then it does not guarantee adequate performance.
We again cite a passage in the Report by Dr. Fudolig (Ref 9) as follows:
“The choice of AWS E10018 is based on D1.1-94. The use of this kind of electrodes is also recommended for Tempcore rebars. It must be noted that AWS E 10018 electrodes are not readily available in the Philippines. The more commonly used electrode for welding of rebars, particularly for conventional type of rebars, is AWS 3 7018, which are also locally produced. Furthermore, cost of ASW E 10018 in the local market is seven (7) times that of AWS E 7018.”
So where is the economy? Even if the Tempcore bars could be allowed for use, the necessary technical welding skills as well as the special electrodes required (which do not even guarantee satisfactory performance) for QT / TMT rebars would provide an insurmountable barrier for its safe usage in general construction in Seismic Zone 4.
4.5 Tack Welding
“Tack welds can be seen as almost insignificant to the site operative. They simply help to add stability to a cage, or facilitate placement. However, placement of weld material on Grade 500E steel (Microalloyed or QT) may well lead to premature failure of the rebar. The tests at Auckland University support this. Reported failures of bars include those due to application of welding and due to inadvertent damage from gas cutting equipment.3] The Department strongly recommends against any tack welding of Grade 500E steel, and urges vigilance by designers, fabricators, contractors and inspectors to avoid damage that could jeopardize the safety of the structure.” 3]
“Q&ST Grade 500 reinforcing cannot be welded without strength loss. It is recommended that a suitable warning be added to the Standard to this effect. This is covered in the amendment to NZS 3101. 4]´”
4.6 Bending problems
Bending of Grade 500 MPa rebars will require that it must be heated if it is to be straightened or re-bent. Straighthening the steel cold will result in work hardened areas reducing the bars ductility just where it needs it when an earthquake happens. To re-bend Grade 500 the steel must be heated 700-800 degrees Celsius which is above the temperature at which QT reinforcing cannot be heated without losing its strength. It is important to note re-bending steel is a specialist process and must be carried out to steel manufacturer’s specifications.
The melting Temperature of steel is over 1500 degrees Celsius well beyond the temperature at which QT starts to lose its strength. Welding of course involves heating steel up to and beyond its melting Temperature and so welding is an obvious problem for QT steel if full strength is to be maintained. 3]
It is important that a QT bar is not heated above its tempering temperature. If it is, the outer strong casing will be tempered and revert to the same properties as the internal core and the bar will be significantly weakened. The temperature that this change starts to occur is as low as 450 degrees Celsius. An MA rebar on the other hand will not change if heated to the same temperature.
The common processes that occur above tempering temperature are hot bending and of course welding.
C8.5.2 NZ Standards:
“Welding of in-line quenched and tempered bars can have detrimental effects on the strength and ductility of the bars and associated connection. AS 3600 requires designers to assume that the strength of such reinforcement has design strength of 250 MPa when raised to the temperatures associated with welding, galvanizing or hot bending. Such a requirement is considered inappropriate in a seismically active country where concentration of yielding at a weld position would be undesirable and could result in brittle failure.
4.7 Heating High-strength and Heat-treated Steels
The effect of elevated temperatures on high strength and heat-treated steels should be thoroughly investigated. For example, quenched and tempered materials will undergo radical changes in their mechanical properties as well as toughness when subjected to temperatures above 260 degrees C (500 degrees F).
Grade 500 MPa reinforcing steel must be heated if it is to be straightened or re-bent. Straightening the steel cold will result in work hardened areas reducing the bars ductility just where it needs it when an earthquake happens. To re-bend Grade 500 the steel must be heated to 700 – 800 degrees Celsius which is above the temperature at which QT reinforcing cannot be heated without it losing strength. It is important to note re-bending steel is a specialist process and must be carried out to the steel manufacturers specifications.
4.8 Use of Couplers and Threading
Cutting a thread in a MA rebar and a QT rebar will yield different results. Because the MA bar has the same strength and ductility properties across its cross section the loss in strength of the bar is proportional to the amount of steel lost in the thread cutting operation. A QT bar on the other hand gains its strength from the hard quenched casing so cutting a thread into this outer casing will mean that the loss in strength is not proportional to the amount of steel which is removed.
“Threading of quench and tempered bar removes some to all the Hardened outer layer resulting in a disproportionate loss of strength.”
4.9 Performance at Elevated Fire Temperatures
Reinforced concrete buildings are exposed to the elevated temperatures during a fire event. Most often the elevated temperatures exceed 500 Degrees Centigrade. Unfortunately this is also about the tempering temperature of QT / TMT rebars. Thus, prolong exposures to elevated temperatures could result in retempering of the outer skin resulting in reversion to the strength of the core steel which is vastly reduced.
Thus, accelerated failure of the RC Building frame during a fire is more likely for a building designed using the Yield and tensile Properties of a QT / TMT rebar whether knowingly or unknowingly.
All the foregoing considerations point to the serious problems associated with the use of QT/TMT rebars where welding, bending, heating, threading and galvanizing temperatures are involved.
What is more compelling is the degraded performance during Cyclic Loading conditions in an Earthquake.
5 SEISMIC PERFORMANCE CONSIDERATIONS
Although, the foregoing are important considerations, the main argument against the use of QT/TMT Rebars in Seismic Zone 4 is its behavior under cyclic loading. Studies in several parts of the world notably Italy, New Zealand and Australia etc have pointed to the dangers associated with the use of QT / TMT rebars under Cyclic loading particularly in Seismic Zone 4.
These do not even include the unsuitability of the same bars when welded under cyclic loading which as the MIRDC study shows, indicate a very limited elongation of the rebars when welded and subjected to static tensile tests.
In a study by Macchi [Ref. 2] a large full scale RC specimen was subjected to cyclic loading to check the ductility of Traditional Steel and TMT rebars conforming to Eurocode EC 8 Seismic detailing.
We quote the experimental results as follows:
“With only one exception, all steel A8 (A8 referring to QT/TMT rebars) specimens failed when tested according to sequences….. In fact, all steel A8 reinforcing bars failed before the end of the Test. In many cases, they failed during the first cycle at the maximum required displacement”
“On the contrary, specimens built with steel Fe (referring to Standard MA Steel rebars) behaved satisfactorily.”
“Quite different behavior in the RC Specimens was observed with the two kinds of steel: *With steel A8 (QT/TMT), plastic strains of the bars were concentrated in a very limited vertical region of the specimen. The high local curvature necessary for the required displacement at the top caused a considerable deterioration, leading to destruction of the concrete cover. The lack of concrete cover allowed the bars in compression to buckle. The bars then failed in tension under reverse action.”
*With steel Fe, the plastic deformation spread for a considerable length along the specimen because of the high strain hardening value fu / fy, local curvature was smaller, the concrete cover remained intact and the bars did not fail. The RC member therefore sustained higher top displacement”
6 CONCLUSION AND RECOMMENDATIONS
There is indeed a Clear and present Danger associated with the use of QT / TMT Rebars in Seismic Zone 4 which encompasses the majority of the Philippine Islands except Palawan.
As shown on this paper, even international Codes such as the New Zealand Code and the Australian Standards prohibit Welding, Heating, Bending, Threading and even Tack welding of QT / TMT rebars. Welding can be used but special electrodes which “cost 7 Times more 10] ” are required with the necessary corresponding welding skills, but even then a reduction in the strength is required which prevent its use in Seismic Zone 4. We again cite in its entirety the prohibitions in the New Zealand Standards as follows:
NZ Standard 3101:2006 Concrete Structures Part 2 Section C-5.8.2 In Line quenched and tempered steel bars
Welding of in-line quenched and tempered bars can have detrimental effects on the strength and ductility of the bars and associated connection. AS 3600 requires designers to assume that the strength of such reinforcement has a design strength of 250 Mpa when raised to the temperature associated with welding, Galvanizing or hot bending. Such a requirement is considered inappropriate in a seismically active country where concentration of yielding at a weld position would be undesirable and could result in brittle failure.
So where is the place of QT / TMT is rebars in our practice?
The answer is:
ONLY IN APPLICATIONS WHERE THE ABOVE PROHIBITIONS ARE NOT APPLICABLE AND CERTAINLY NOT FOR HIGH RISE BUILDINGS IN ZONE 4.
7. THE ROAD AHEAD
The structural Engineering Profession and Consultants in General can no longer postpone action on the CONTINUED USE unqualified use of QT / TMT rebars for high rise buildings in Seismic Zone 4.
We must encourage the Philippine Steel Industry through the PISI to again bring the MA rebars in the market by categorically specifying this in our design and categorically stating that QT / TMT rebars are not to be supplied as an alternative in Seismic Zone 4 Building Designs.
The weak argument is that it will increase the cost of rebars. However, the author asks: Is there a Price on Public Safety?
If we do not do this and with the Publication of this Paper and similar papers, the Engineering community is now formally informed of the dangers associated with the continued use of QT / TMT rebars in Seismic Zone 4.
REFERENCES
Macchi G. “Ductility Requirements for Reinforcement under Eurocodes.” Structural Engineering International April 1996.
New Zealand Standard NZS 3101-2006 Amendment 1 –Concrete Structures Standard The Design of Concrete Structures.
Jitendra K Bothara “Comparing Seismic® QT and Seismic® MA, High Strength Bars and Design Considerations”.
PISI Letter of Mr Wellington Tong – President to ASEP
Fudolig,A et al “Characterization of Locally-Manufactured Quenched tempered and Self Tempered Reinforcing Steel Bars” MIRDC Feb 1999.
New Zealand Department of Building and Housing “Report on Grade 500 E Reinforcement” July 2005 Wellington NZ
Bureau of Product Standards, DTI “PNS 49:2002 Steel Bars for Reinforced Concrete- Specification”
ABOUT THE AUTHOR
Emilio M. Morales CE, Principal of EM2A Partners & Co., Master of Science in Civil Engineering, Carnegie Mellon University, Pittsburgh Pa., Fellow ASCE, PICE, and ASEP and a PhD Candidate at the Asian Institute of Technology, Bangkok Thailand.
Formerly Senior Lecturer, UP Graduate Division, School of Civil Engineering, Diliman, Quezon City. He can be contacted at EM2A Partners & Co., No. 17 Scout de Guia corner Scout Reyes Streets, Diliman, Quezon City. Telephone Nos. 371-1804 & 06. E-mail address: em2apartners@gmail.com.
1] Principal EM2A Partners, MS in Civil Engineering , Carnegie Mellon University, Pittsburgh Pa., Fellow PICE, ASEP and ASCE. PhD Candidate Asian Institute of Technology, Bangkok Thailand, Formerly Senior Lecturer, UP Graduate Division, School of Civil Engineering, Diliman. 2] Macchi G. “Ductility Requirements for Reinforcement under Eurocodes.” Structural Engineering International April 1996.
3] Jitendra K Bothara “Comparing Seismic® QT and Seismic® MA, High Strength Bars and Design Considerations”.
4] New Zealand Standard NZS 3101-2006 Amendment 1 –Concrete Structures Standard The Design of Concrete Structures. 5] Macchi G., “Ductility Requirements for Reinforcement under Eurocodes.” Structural
6] Philippine Iron and Steel Institute. 7] PISI Letter of Mr Wellington Tong – President to ASEP 8] Fudolig,A et al “Characterization of Locally-Manufactured Quenched tempered and Self Tempered Reinforcing Steel Bars” MIRDC Feb 1999.
9] New Zealand Department of Building and Housing “Report on Grade 500 E Reinforcement” July 2005 Wellington NZ
10] Professional Waiver kindly granted by Dr. Fudolig of MIRDC. 11] Fudolig A. et al – “Characterization of Locally-Manufactured Quenched Tempered and Self Tempered Reinforcing Steel Bars” MIRDC Feb 1999.
12] Bureau of Product Standards, DTI “PNS 49:2002 Steel Bars for Reinforced Concrete- Specification”